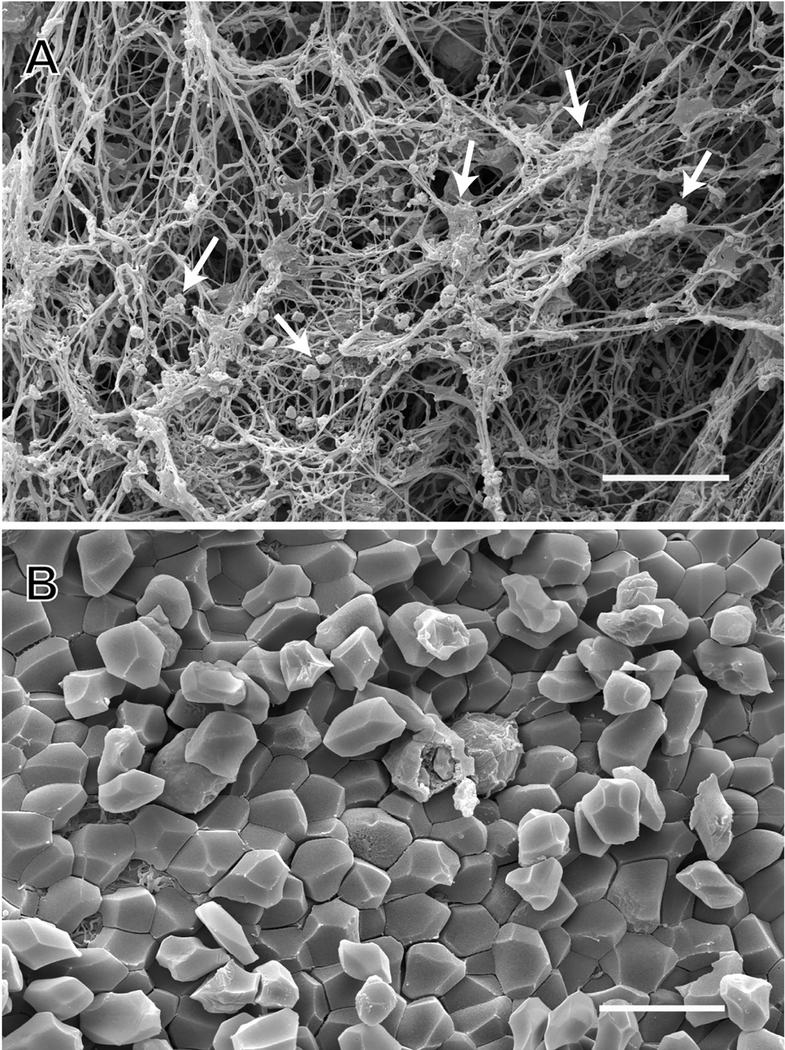
Figure 3: SEM of arterial thrombi taken from patients by thrombectomy.
SEM images show A) single and aggregated platelets (white arrows) and fibrin in an arterial thrombus; an example of the appearance of the outside of a contracted blood clot or thrombus; B) polyhedrocytes (compressed polyhedral erythrocytes) in an arterial thrombus; an example of the interior of a contracted blood clot. Scale bars = 10 μm. Image credit: from the laboratory of John W. Weisel: Rafael R. Khismatullin and Rustem I. Litvinov.

