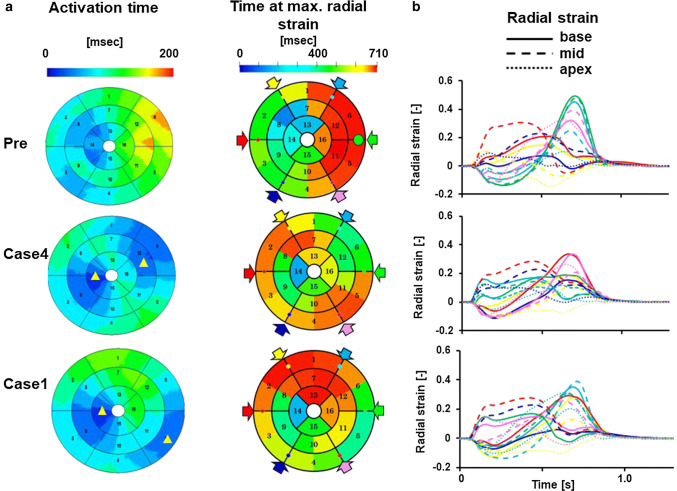
Fig. 5.
Evaluation of dyssynchrony. a Electrical activation time and time at maximum radial strain are shown by color in the bull’s eye view of the left ventricle and compared among pre-CRT, case 4 and case 1. Yellow triangles indicate the approximate position of pacing sites. b Temporal changes in radial strain, which was measured in 16 segments, compared among pre-CRT, case 4, and case 1. Data were sampled at the base (solid lines), mid-ventricular (broken lines), and apical (dotted lines) levels in six circumferential locations, which are indicated by color arrows in the bull’s eye view. However, red and green were omitted at the apical level

