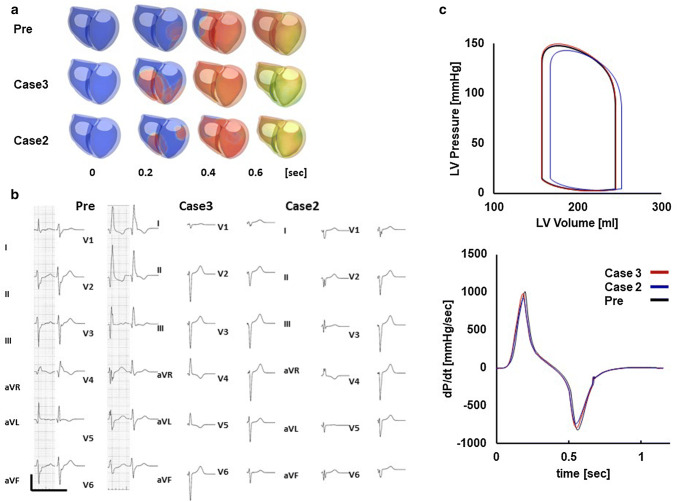
Fig. 6.
Patient-specific model and effect of CRT of a non-responder (patient #6). a Time-lapse images showing propagation of activation (color) and contraction before treatment (Pre), with the lead position that produced the best outcome (case 3) and the worst outcome (case 2). The numbers indicate the time after onset of activation. b Actual (left column) and simulated (right column) ECG under the three conditions. c Pressure–volume loop of the left ventricle (upper panel) and dP/dt (lower panel) under the three conditions (Pre: black line, case 3: red line, case 2: blue line)

