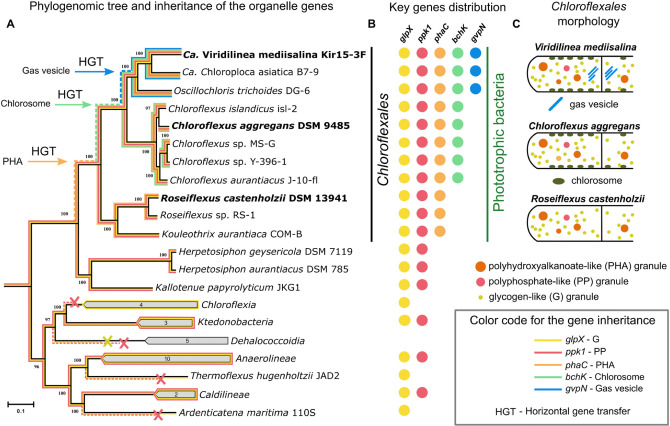
FIGURE 5.
Maximum-likelihood phylogenetic tree (black line) inferred from concatenated alignment of 120 single-copy phylogenetic marker (GTDB dataset) genes (A). List of genomes included in the phylogenetic analysis was presented in Supplementary Table S1. Distribution of glpX, ppk1, phaC, bchK, and gvpN genes that encode the proteins for biogenesis of the intracellular bodies across Chloroflexota phylum (B). Inheritance of the key genes is shown on the phylogenetic tree (colored lines). The dashed colored lines denote hypothetical inheritance from common ancestor of a clade. Schematic illustration of the main Chloroflexales morphotypes (C).

