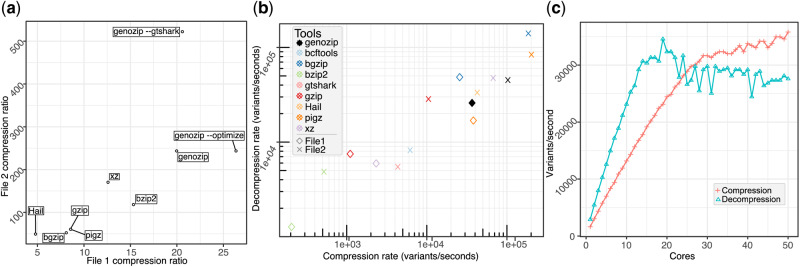
Fig. 1.
Benchmarking genozip performance. (a) Compression ratios for genozip using three different options relative to five other commonly used compression tools (see labels) for two VCF files, the FORMAT-subfields-rich data (x-axis) and genotype-rich data dominant (y-axis). (b) Compression (x-axis) and decompression (y-axis) rates for genozip and five other tools on the two VCF files (see inset key), and the rates (c) genozip execution scalability with used CPU cores (see Supplementary Material)

