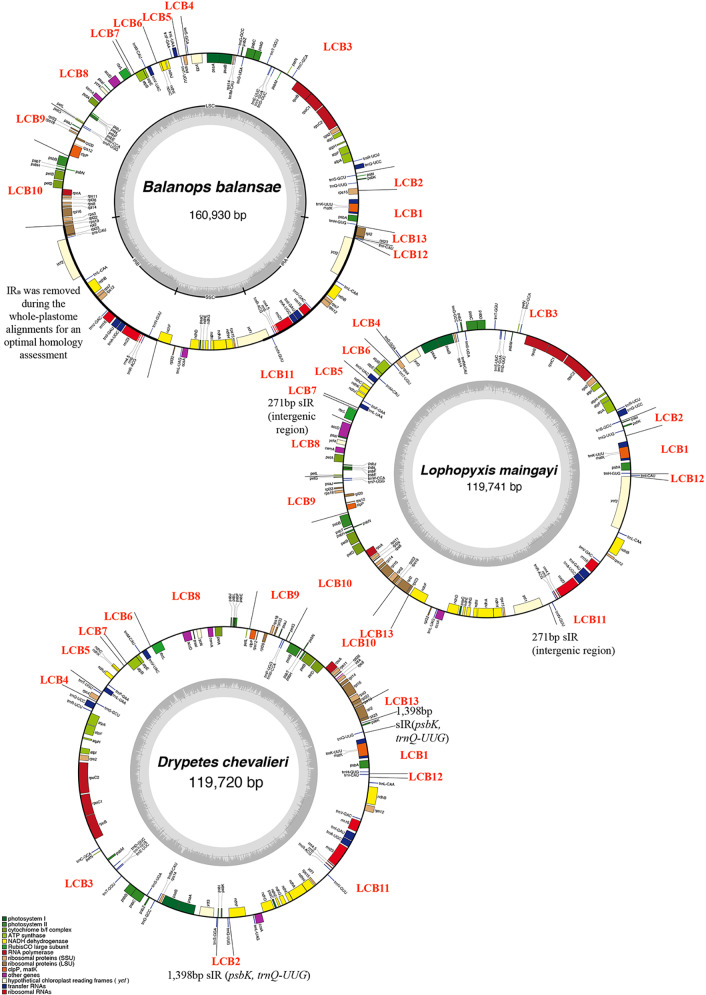
Figure 1.
Plastid genomes of three species of Malpighiales representing three genera involved in this study. GC content graphs are shown as dark gray bars toward the center of each diagram. Each Locally Collinear Block (LCB) was indicated in the circular map, as well as the ~12kb short Inverted Repeat (sIR) and 271bp sIR.

