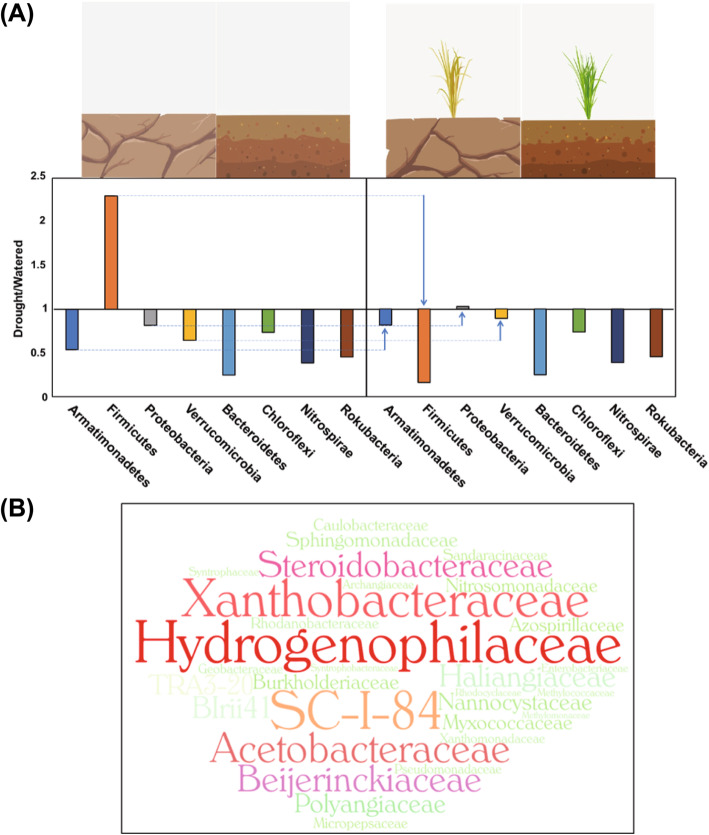
Fig. 4.
Model of the microbiome shift following a change in soil state and the presence of plants. The microbial shift produces two distinct clusters and suggests the dominance of six families belong to Proteobacteria under drought condition. a The left panel shows the ratio of drought to watered condition in the absence of plant for eight phyla and right one shows the ratio in the presence of plant for eight phyla selected from two clusters affected by drought. When watered soil with plants shift to drought with plants, phyla showing significant population shift are indicated with vertical arrows and dotted lines (p-value < 0.05; two-way ANOVA of both factors) (Table S6). The x-axis represents the ratio of drought to watered condition and y-axis indicates eight phyla significantly affected by drought. b The WordCloud refers to 13 families within the Proteobacteria that shift significantly as a cluster in the presence of both drought stress and plants (Table S9). Six families have statistically significant p-values and are presented in bigger size of letters with different color; these exhibit the same pattern as Proteobacteria in response to drought conditions in the presence of plants. The word sizes indicate the relative abundance ratio under drought conditions

