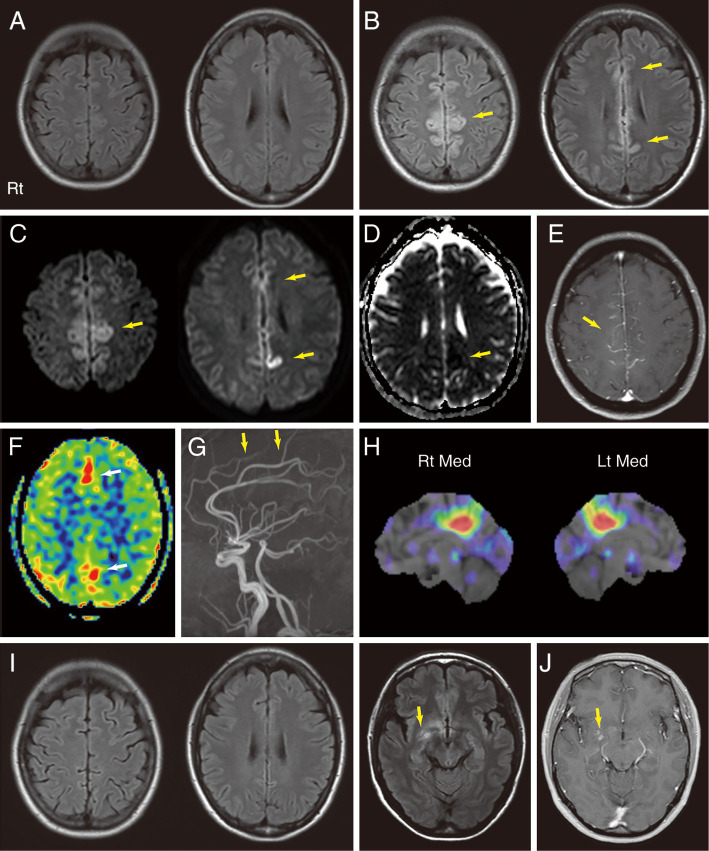
Figure 1.
Brain MRI and SPECT findings. A: Axial FLAIR images taken two weeks before the first admission (after the first episode of EPC) appeared normal. B-G: MRI scans obtained at the first admission. On the fifth day of the admission, axial FLAIR imaging (B) showed hyperintense lesions (arrows), and diffusion-weighted imaging (C) revealed hyperintense lesions (arrows) extending bilaterally from the mesial frontal cortices to the posterior cingulate cortices. Parts of the same area exhibited low ADCs (arrow) (D). Gadolinium-enhanced T1-weighted imaging (E) showed corresponding leptomeningeal enhancement alongside the cerebral falx (arrow). ASL imaging (F) showed hyperintensities in the same area (arrows). MRA (G) showed an increased signal (arrows) in the anterior cerebral artery territory. H: After the first discharge, three-dimensional stereotactic surface projections of interictal [123I]-iodoamphetamine SPECT data showed an area of focally decreased perfusion in the bilateral posterior cingulate cortices but no areas of increased perfusion. I: FLAIR imaging performed at the second admission showed that the original hyperintensities in the medial frontoparietal areas were no longer visible. New hyperintensities (arrow) emerged in the right mesial frontotemporal areas. J: Part of the same areas exhibited gadolinium enhancement (arrow). ADC: apparent diffusion coefficient, ASL: arterial spin labeling, FLAIR: fluid-attenuated inversion recovery, Lt: left, Med: Medial, MRA: magnetic resonance angiography, MRI: magnetic resonance imaging, Rt: right, SPECT: single-photon emission computed tomography

