
Figure 3.
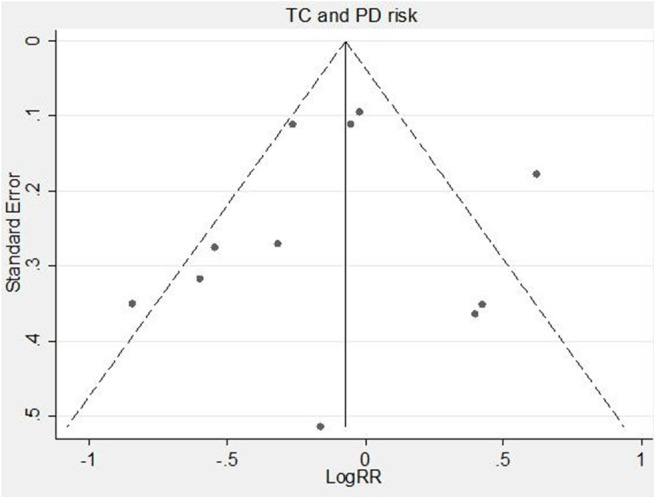
Funnel plot of serum TC levels and risk of PD. RR, relative risk; TC, total cholesterol; PD, Parkinson's disease.
Official websites use .gov
A
.gov website belongs to an official
government organization in the United States.
Secure .gov websites use HTTPS
A lock (
) or https:// means you've safely
connected to the .gov website. Share sensitive
information only on official, secure websites.
Funnel plot of serum TC levels and risk of PD. RR, relative risk; TC, total cholesterol; PD, Parkinson's disease.