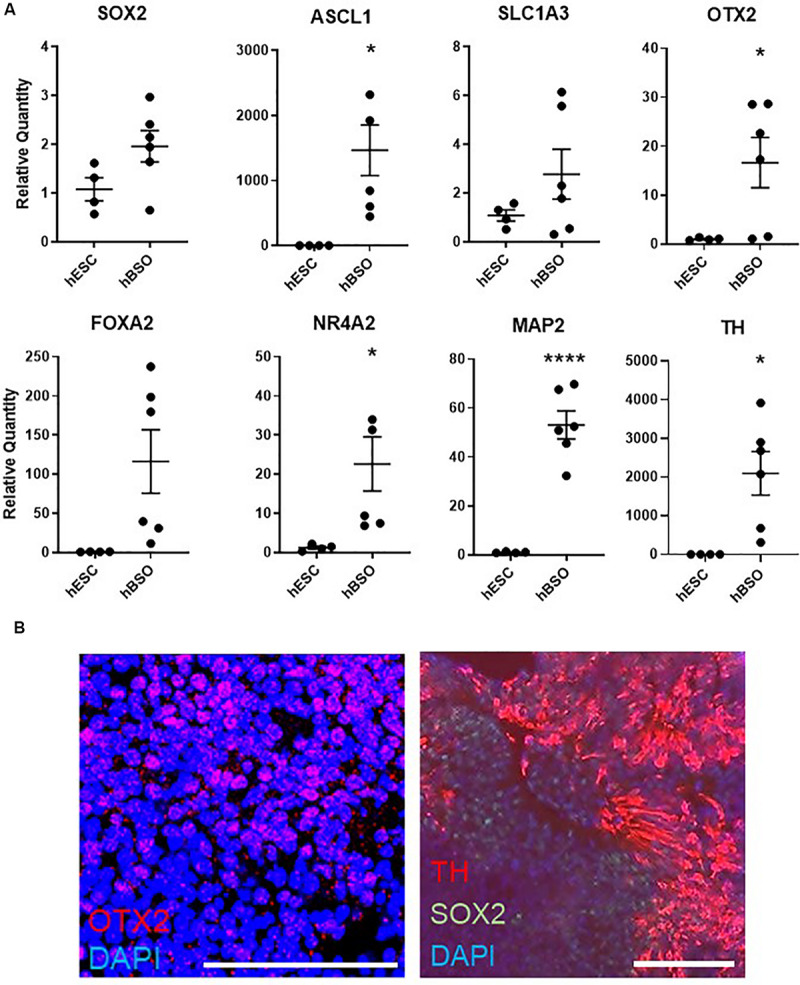
FIGURE 2.

Quantitative PCR and immunohistochemical analysis of 1-month-old hBSOs from hESCs. (A) Quantitative PCR analysis of 1-month-old hBSOs for the markers of neural stem/progenitor cell (SOX2, Mash1, SLC1A3), mature neuron (MAP2), midbrain (OTX2), and mDA (FOXA2, NR4A2, TH). Error bars indicate mean ± SEM; *p = 0.0167 (ASCL1), *p = 0.0412 (OTX2), *p = 0.0387 (NR4A2), ****p < 0.0001 (MAP2), *p = 0.0178 (TH). (B) Immunohistochemical staining of midbrain marker (OTX2), mDA marker (TH), and neural stem cell marker (SOX2) at 1 month. Bars = 100 μm.
