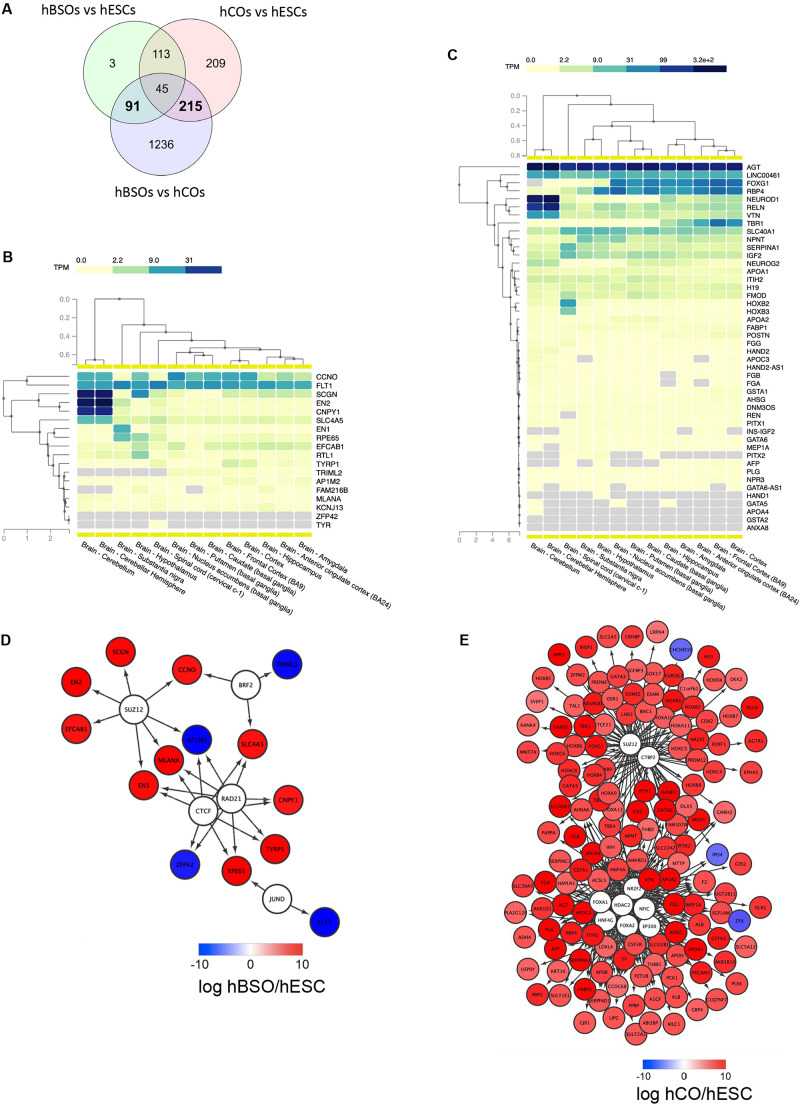
FIGURE 5.
RNA-seq transcriptomic analysis of 1-month old hBSOs from hESCs. (A) Venn diagrams of the number of genes differentially expressed between human brainstem organoids (hBSOs), human cerebral organoids (hCOs), and hESCs. (B) Clustering brain regions based on the expression of differentially expressed genes selective in hBSOs (FDR < 10%). (C) Clustering brain regions based on the expression of differentially expressed genes selective in hCOs (FDR < 3%). (D) Transcription factors that potentially regulate the differentially expressed genes in hBSOs. (E) Transcription factors that potentially regulate the differentially expressed genes in hCOs.

