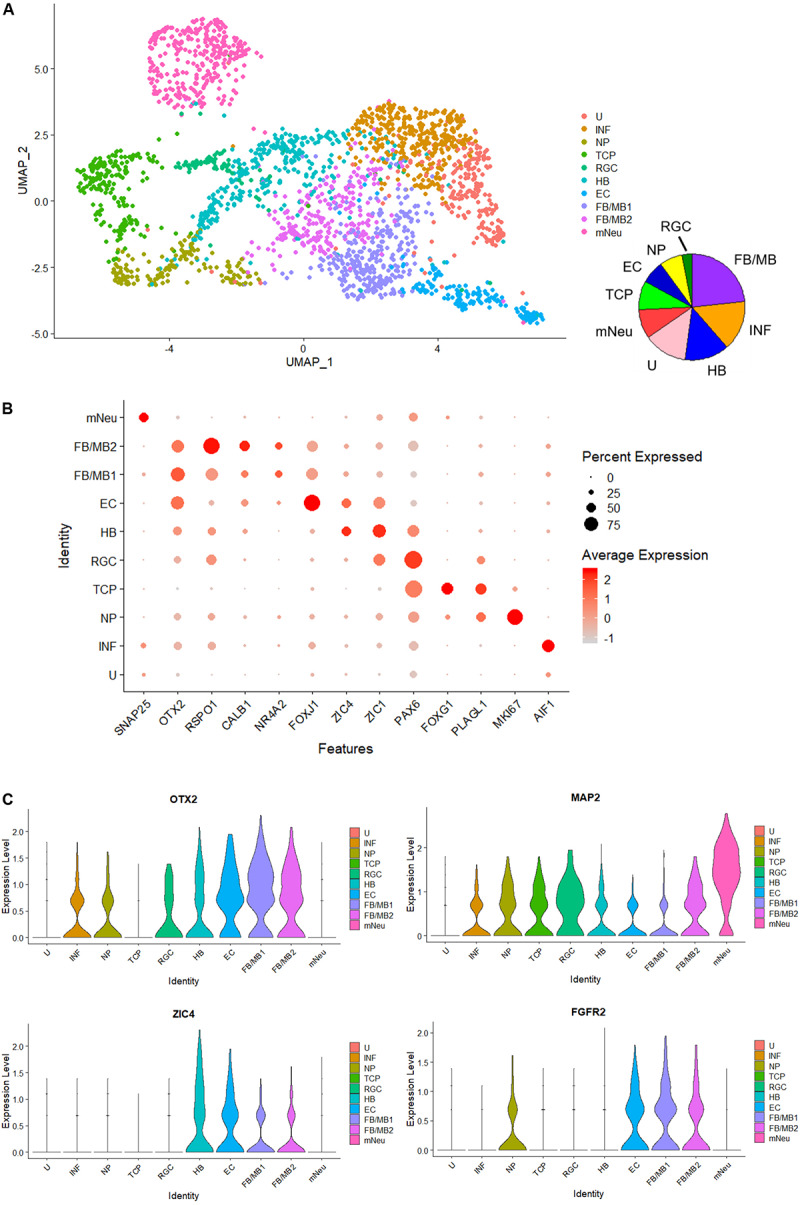
FIGURE 6.

Single-cell RNA-seq analysis of 1-month-old hBSOs from hESCs. (A) Unsupervised clustering of all cells from human brainstem organoids. INF; inflammation, NP; neuronal progenitors, TCP; telencephalic progenitors, RGC; radial glia cells, HB; hindbrain, EC; ependymal cells, FB/MB; forebrain and midbrain, mNeu; mature neurons, U; unknown. (B) Dot plots showing a selection of genes that identify cell population types. (C) Cell distribution plot of OTX2, FGFR2, ZIC4, and MAP2.
