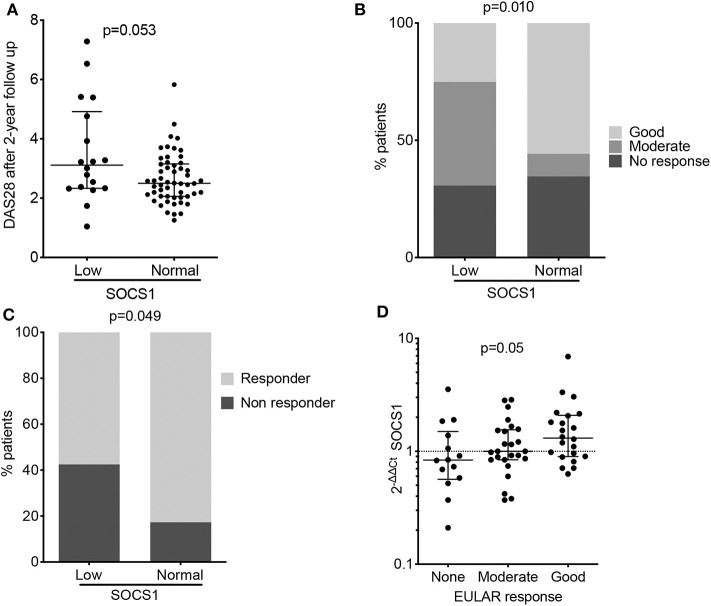
Figure 2.
Baseline SOCS1 expression as a severity biomarker in patients with RA (PEARL study). (A) Disease activity estimated by DAS28 score after 2 years of follow-up, relative to baseline SOCS1 expression levels. Data shown as individual values with median and interquartile range. Statistical significance was established by the Mann-Whitney U test; low SOCS1 levels (n = 25) were defined as those values below percentile 25 at the baseline of PEARL population; the remaining patients were considered to have a normal SOCS1 level (n = 67). (B) Percentage of patients classified by EULAR response criteria after 12 months follow-up in PEARL subpopulations. Statistical significance was determined by the χ2 test. low SOCS1 levels (n = 25) were defined as those values below percentile 25 at the baseline of PEARL population; the remaining patients were considered to have a normal SOCS1 level (n = 67) as described for panel (A). (C) Percentage of responder and non-responder patients after 6 months rituximab infusion. Low SOCS1 levels (n = 14) were defined as those values below percentile 25 at the baseline of the Leeds established RA population; the remaining patients were considered to have a normal SOCS1 levels (n = 48). Statistical significance was determined as in (B). (D) Baseline SOCS1 expression relative to EULAR response criteria after 6-months rituximab infusion (Leeds study). Data shown for mRNA SOCS1 levels normalized to ACTB and to mean SOCS1 expression levels in healthy donors (2−ΔΔCt); error bars show medians and interquartile range; (n = 14 no response, n = 25 moderate response and n = 23 good response). Statistical significance was determined using Cuzick's non-parametric trend test.

