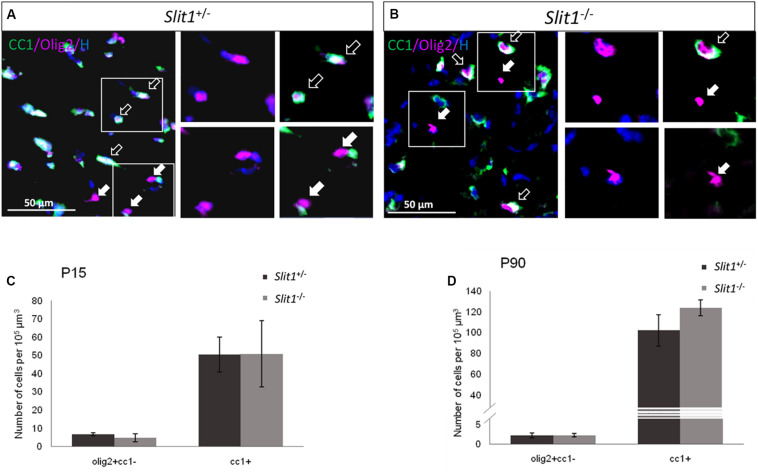
FIGURE 1.
Oligodendroglial differentiation in developing and mature white matter at P15 and P90. (A,B) Representative illustrations of Olig2 (red) and CC1 (green) expressing cells (Hoechst, blue), in the corpus callosum of Slit1+/− (A) and Slit1–/– (B) mice, at P90. (C,D). Full arrows point to examples of Olig2+ OPCs and empty arrows to Olig2+/CC1+ oligodendrocytes, Quantification shows no significant difference in the number of the different cell types between Slit1+/− and Slit1–/– mice at P15 (C) or P90 (D). Scale bar, 50 μm. Results are expressed as means ± SEM and analyzed with a Mann Whitney test.

