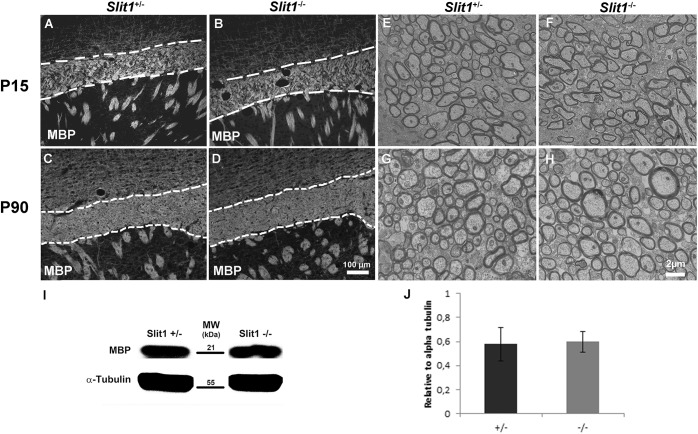
FIGURE 2.
Time-course analysis of developmental myelination. (A–D) No difference in MBP immunodetection between Slit1+/− (A,C) and Slit1–/– (B,D) mice on corpus callosum (broken lines) frozen section of P15 (A,B) and P90 (C,D). (E–H) Electron microscopy reveals no difference in the density of myelinated axons or myelin structure between Slit1+/− (E,G) and Slit1–/– (F,H) at P15 (E,F) and P90 (G,H). Scale bar, 100 μm (A–D) and 2 μm (E–H). (I–J) No difference in MBP levels by Western blot at P90. Results are expressed as means ± SEM and analyzed with a Student’s t-test, ∗P < 0.05.

