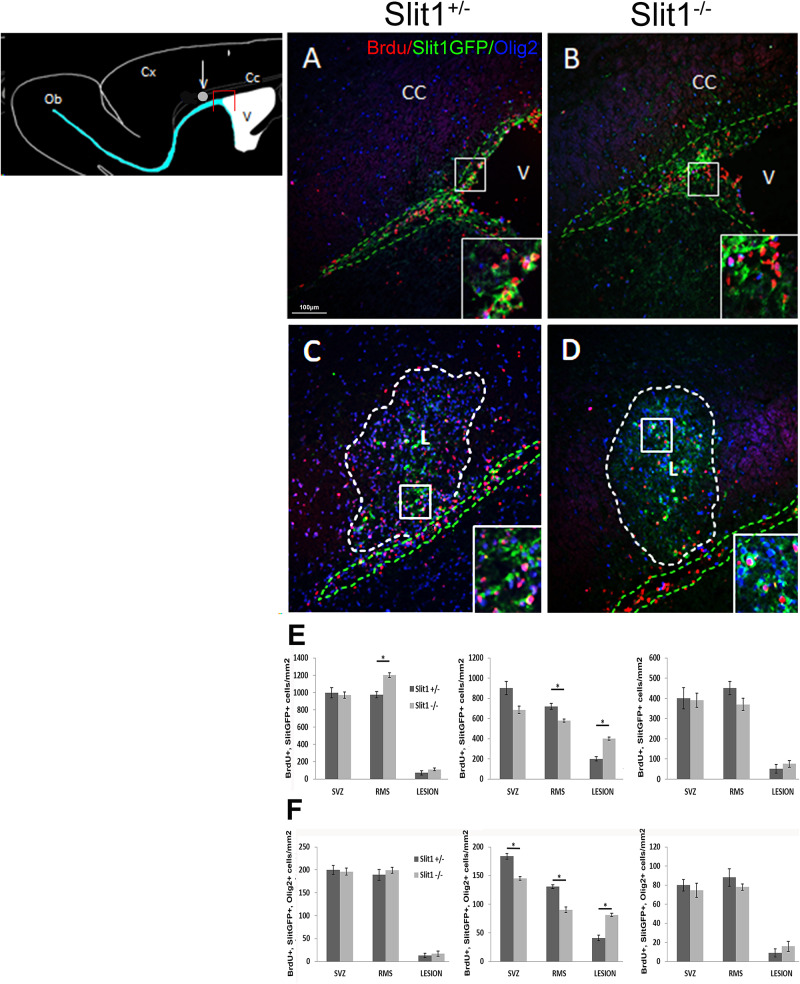
FIGURE 5.
Recruitment of the SVZ-derived progeny by the LPC-induced lesion of the corpus callosum at 6 dpi. The scheme represents the areas of interest: the lesion (white circle) and the SVZ (red box). (A–D) illustrates the presence of BrdU+ and Slit-GFP+ cells on sagittal forebrain sections at the levels of the (A,B) SVZ and (C,D) corpus callosum lesion of Slit1+/− (A,C) and Slit1–/– (C,D) mice. Insets are higher magnifications illustrate Slit-GFP+ cells expressing BrdU. (E,F) Quantification at the level of the SVZ, RMS and lesion at four (left graphs), six (middle graphs) and 12 dpi (right graphs) indicates that BrdU+/Slit1-GFP+ (E) and BrdU+/Slit-GFP+/Olig2+ (F) cells colonize the lesion more efficiently in Slit1–/– animals, than in Slit1+/− controls. Note that parenchymal Olig2+ cells including adult OPC, do not express GFP. Insets illustrate BrdU+/GFP+ cells at higher magnifications. Broken lines in green delineate the SVZ (A,B) and RMS (C,D) and in white, define the lesion (C,D). V, lateral ventricle; CC, Corpus Callosum, L, lesion. Scale bar, 100 μm. Results are expressed as means ± SEM and analyzed with a Student’s t-test, ∗ = P < 0.05.

