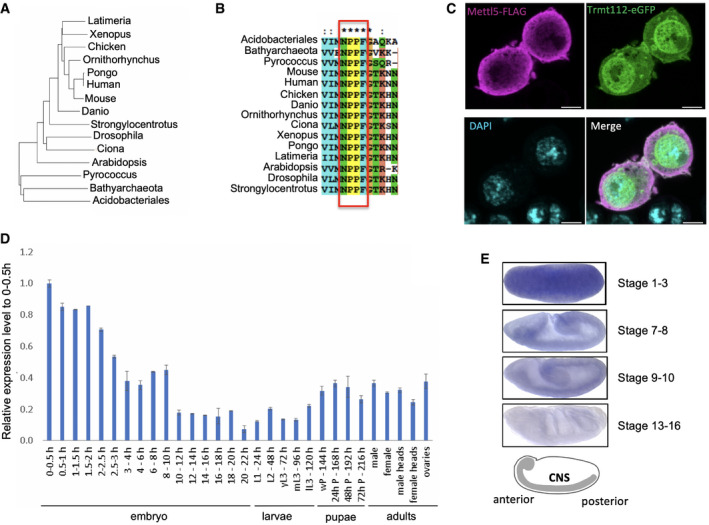
Figure 2. Phylogenetic and expression analyses of Mettl5.

- Phylogenetic tree of the alignment of representative Mettl5 orthologs from selected species (see Materials and Methods for details). Prokaryotic sequences from archaea (Pyrococcus, Bathyarchaeota) and bacteria (Acidobacteriales) are included as outliers.
- Multiple sequence alignment of Mettl5 orthologs showing conservation of the NPPF motif. Asterisks indicate perfect conservation.
- Subcellular localization of Mettl5‐FLAG (purple) and Trmt112‐eGFP (green) expressed under the control of their own promoter in S2R+ cells. 63× magnified merge of immunofluorescently labeled S2R+ cells. Scale bar: 4.47 μm.
- Developmental expression of Mettl5 transcript assayed by RT–qPCR analysis. The figure shows mean ± standard deviation of three technical measurements from three biological replicates.
- In situ hybridization of Mettl5 transcript at different embryonic stages. The central nervous system (CNS) is highlighted in the schematics. Data retrieved from FlyExpress 7 (http://www.flyexpress.net/search.php?type=image&search=FBgn0036856).
