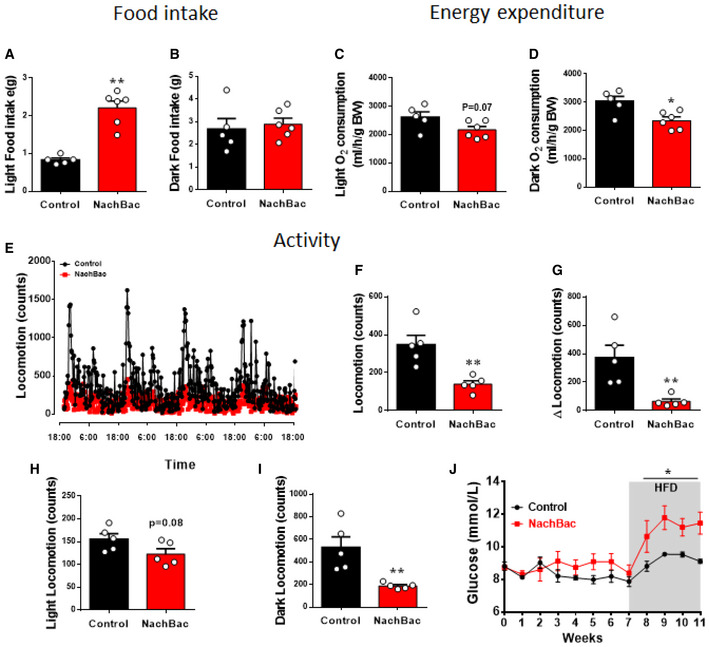
Figure EV3. The effect of NachBac expression in PVH CRH neurons on energy balance.

-
A–DComparison between controls and NachBac mice feeding in light (A, **P < 0.0001) and dark periods (B, P = 0.6773), and energy expenditure in light (C, P = 0.0676) and dark periods (D, *P = 0.0138), which is from the same data presented in Fig 3D–I.
-
E–IComparison between controls and NachBac mice for locomotion patterns as measured in CLAMS cages (E), for average activity (F, **P = 0.004), for difference between light and dark periods (G, **P = 0.0082), for difference during light periods (H, P = 0.0813) and during dark periods (I, **P = 0.0068).
-
JGlucose levels measured during early morning in feeding ad libitum mice every week after NachBac vector delivery, which is from the same group of mice presented in Fig 3A (*P < 0.0001).
