-
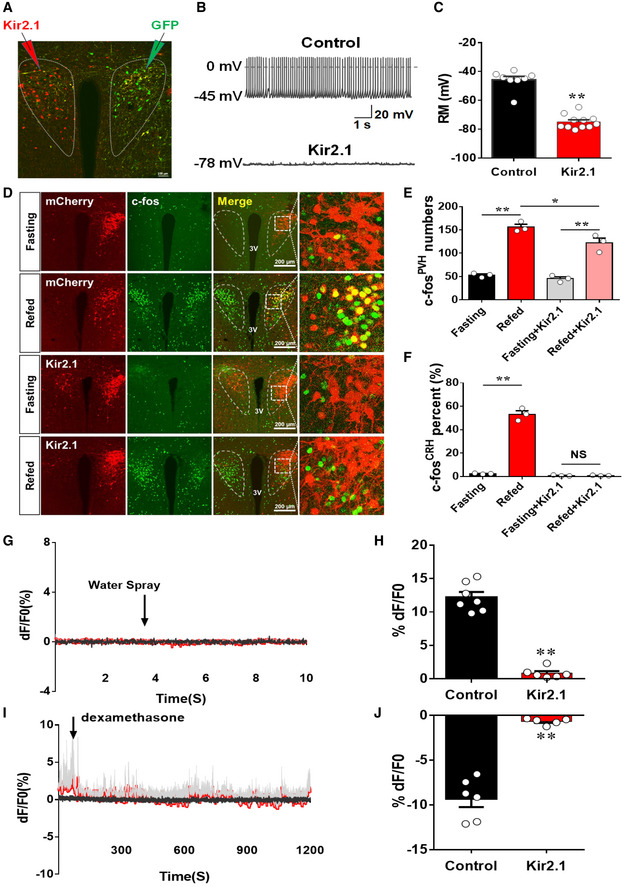
A–C
CRH‐Cre male mice received stereotaxic delivery of AAV‐EF1a‐DIO‐Kir2.1‐P2A‐dTomato vectors and AAV‐Flex‐GFP at 7–8 weeks of age, and recording was made at least 4 weeks after viral delivery on neurons with Kir2.1 (one side) or control GFP neurons (contralateral side) of the same animal (A); typical spontaneous neuron activity recorded in GFP controls (B, top panel) and Kir2.1 neurons (B, bottom); and comparison in resting membrane potentials between the two groups (C, **P < 0.0001, unpaired Student's t‐test).
-
D–F
CRH‐Cre male mice were injected with either AAV‐Flex‐mCherry or AAV‐EF1a‐DIO‐Kir2.1‐P2A‐dTomato to examine c‐Fos expression in the PVH in 24 h fasting or refed after fasting. (D) Representative images showing CRH neurons expressing mCherry or Kir2.1 (mCherry in the top two rows and Kir2.1 in the bottom two rows of the second column), c‐Fos expression (green in the first column), merged images of red and green (the third column), and the amplified pictures for the boxed areas in the merged images (the fourth column). The experimental conditions for each group (fasting versus refed) are labeled on the left. (E, F) Comparison of average neuron numbers from cell counting on total number of c‐Fos‐positive neurons in the PVH (E, **P = 0.0001: fasting versus refed; *P = 0.0497: refed versus refed/Kir2.1; **P = 0.0025: fasting/Kir2.1 versus refed Kir2.1) and total number of c‐Fos‐positive CRH neurons (F, **P < 0.0001: fasting versus refed; P = 0.9586: fasting/Kir2.1 versus refed/Kir2.1), n = 3–4 each, two‐way ANOVA tests. All data presented as mean ± SEM.
-
G–J
CRH‐Cre male mice received stereotaxic delivery of a mixture of AAV‐Flex‐GCaMP6m and AAV‐EF1a‐DIO‐Kir2.1‐P2A‐dTomato vectors at 7–8 weeks of age with optic fiber implantation targeting PVH neurons. (G–H) Representative traces showing typical responses of PVH CRH neurons to water spay (arrows) in Kir2.1 mice (G) and comparison of responsiveness to water spray between Kir2.1 and control mice (H). (I, J) Representative traces showing typical responses of PVH CRH neurons to water spay (arrows) in Kir2.1 mice (I) and comparison of responsiveness to water spray between Kir2.1 and control mice (J).Gray traces showed Ca2+‐independent signal for system stability, and red ones showed Ca2+‐dependent signals for neuron activity, N = 5 each, males, data presented as mean ± SEM, **P < 0.0001 in both (H and J), unpaired Student's t‐tests.
Data information: All mice were fed chow unless otherwise noted. 3V: the third ventricle; downward arrows indicating onset of stimuli or Dex injections. Scale bar = 200 μm.