Figure 3.

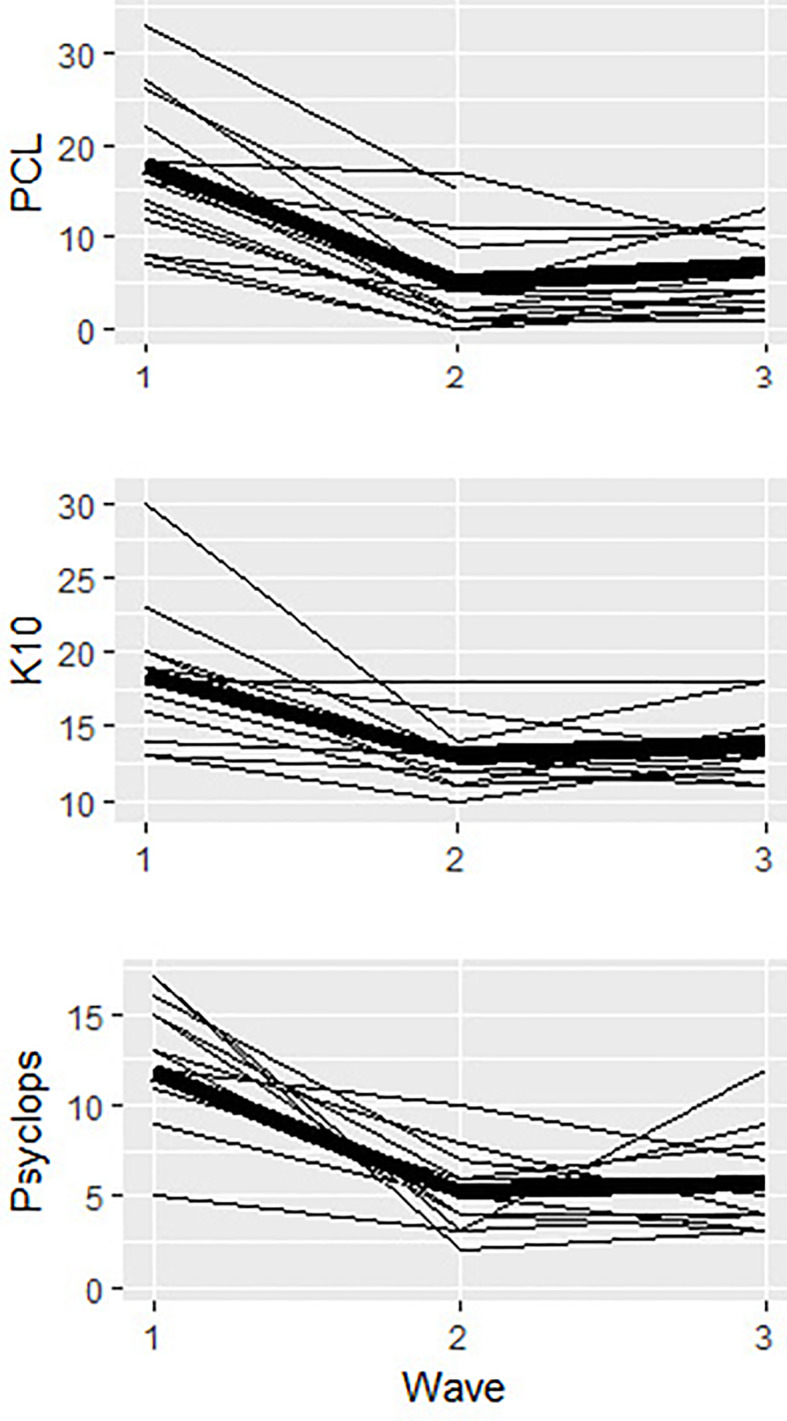
Plots of inidividual trajectories for all outcome measures (K10, PCL-5, Psychlops) across pre-intervention (wave 1), post-intervention (wave 2) and follow-up (wave 3). The main trajectory for each otucome is in bold.

Plots of inidividual trajectories for all outcome measures (K10, PCL-5, Psychlops) across pre-intervention (wave 1), post-intervention (wave 2) and follow-up (wave 3). The main trajectory for each otucome is in bold.