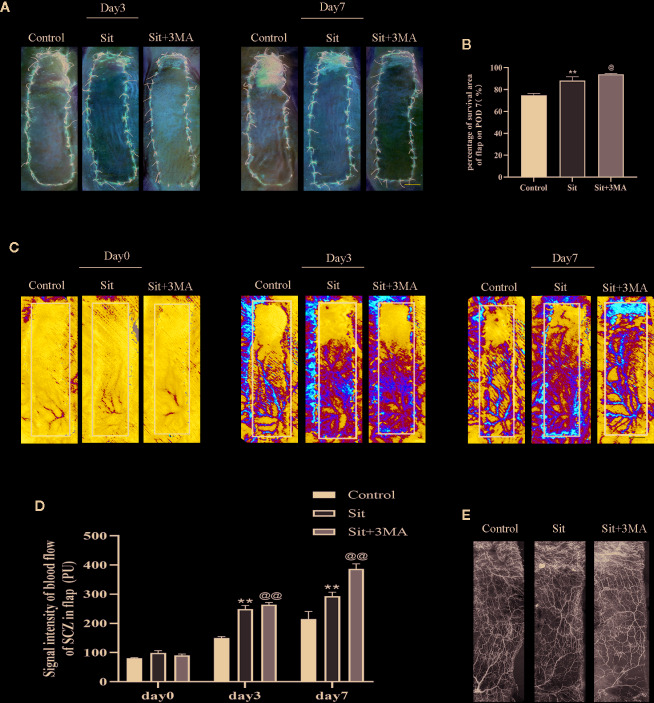
Figure 2.
Sit and 3MA ameliorate multiterritory perforator flap survival. (A) Digital photographs of flap survival/necrosis area on the 3rd and 7th PODs in the control, Sit, and Sit+3MA groups. (B) The percentages of survival area in each group. (C) LDBF imaging showing vascular flow and blood supply in a perforator flap on the 0, 3rd, and 7th PODs in the control, Sit, and Sit+3MA groups. (D) Histogram representing the quantified signal intensity on the 0, 3rd, and 7th PODs. (E) Flap angiograms on the 7th PODs and the vasculature was in a mass in the necrosis area. **p < 0.01, vs control group; @p < 0.05 and @@ < 0.01, vs Sit group. Data are expressed as mean ± standard error, n = 6 per group.

