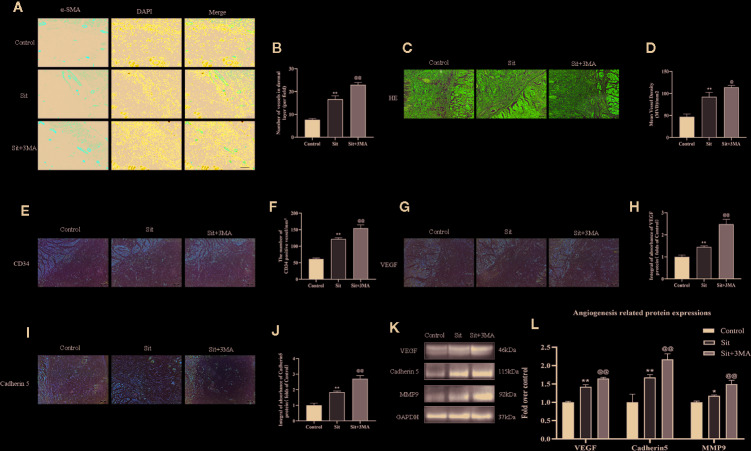
Figure 4.
Effect of Sit-induced autophagy on angiogenesis in the perforator flap. (A) Microvessels (red) in SCZ of flaps in the control, Sit, and Sit+3MA groups were estimated by immunofluorescence staining for α-SMA in the dermal layer (scale bar: 20 µm). (B) Histograms representing percentages of α-SMA labeled microvessels in each group. (C) H&E staining exhibiting subcutaneous histology of the flap, showing microvessels in SCZ in the control, Sit, and Sit+3MA groups (original magnification ×200; scan bar, 50 μm). (D) Histogram indicating percentage of mean vessel density in each group. (E) IHC for CD34 positive vessels in the control, Sit, and Sit+3MA groups (original magnification ×200; scale bar, 50 µm). (F) Histogram of the percentage of CD34-positive vessel density in each group. (G, I) IHC for VEGF and Cadherin 5 expression in the flap in the control, Sit, and Sit+3MA groups (original magnification ×200; scale bar, 50 µm). (H, J) The optical density values of VEGF and Cadherin 5 in each group. (K) The expressions of MMP9, VEGF, and Cadherin 5 detected by western blotting in the control, Sit, and Sit+3MA groups. All gels have been run under the same experimental conditions and cropped blots are used here. (L) Histogram of the optical density values of MMP9, VEGF, and Cadherin 5 in each group. *p < 0.05 and **p < 0.01, vs control group; @p < 0.05 and @@p < 0.01, vs Sit group. Data are presented as mean ± standard error, n = 6 per group.

