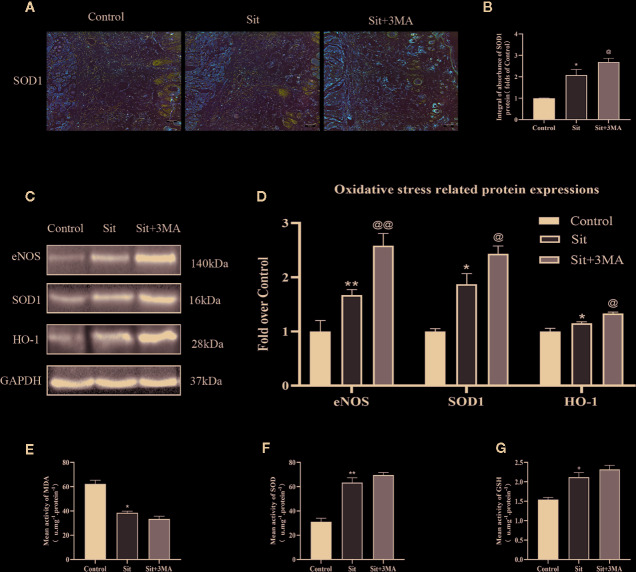
Figure 5.
Effect of Sit-induced autophagy on oxidative stress in the perforator flap. (A) IHC for SOD1 expression in the perforator flap in the control, Sit, and Sit+3MA groups (original magnification ×200; scale bar, 50 µm). (B) Histogram of optical density values of SOD1 quantified and analyzed by IHC. (C) The expressions of SOD1, eNOS, and HO1 as revealed by western blotting in the control, Sit, and Sit+3MA groups. Gels have been run under the same experimental conditions and cropped blots are used here. (D) Histogram of oxidative stress related protein expressions of SOD1, eNOS, and HO1 in each group. (E) MDA level evaluated using modified thiobarbituric acid test. (F) Total SOD activity evaluated using xanthine oxidase method. (G) GSH level evaluated using modified 5,5'-dithiobis method. *p < 0.05 and **p < 0.01, vs control group; @p < 0.05 and @@p < 0.01, vs Sit group. Data are presented as mean ± standard error, n = 6 per group.

