Figure 1.
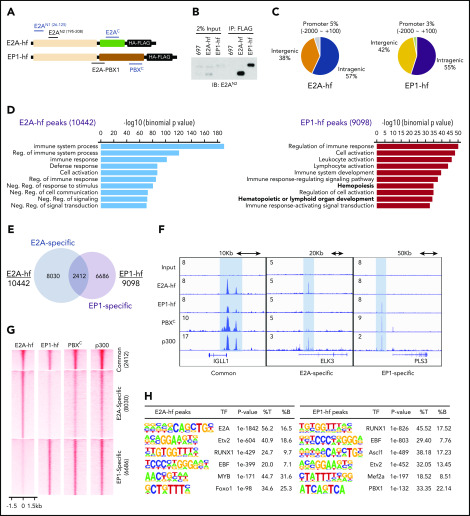
RUNX1 and EBF1 motifs are enriched at E2A-PBX1–bound genomic sites. (A) Schematic of C-terminal HA-FLAG–tagged E2A (E2A-hf) and E2A-PBX1 (EP1-hf) and the epitopes of antibodies used in ChIP-seq (blue) and immunoblotting (black) assays. (B) Immunoblots of E2A and E2A-PBX1 from stable doxycycline-induced 697 lines expressing either E2A-hf or EP1-hf. (C) Genomic distribution of E2A-hf (left) and E2A-PBX1 (EP1-hf, right) ChIP-seq peaks relative to gene loci. (D) Gene Ontology biological processes of E2A-hf– and E2A-PBX1-hf–associated ChIP-seq peaks using GREAT analysis.27 (E) Venn diagram showing the overlap between E2A-hf and EP1-hf ChIP-seq peaks. (F) ChIP-seq profiles of E2A-hf and EP1-hf in stable 697 lines and the C-terminal region of PBX1 (PBXC) and p300 antibodies in 697 lines at identified common or specific targets. (G) Heatmaps showing the ChIP-seq signals for E2A-hf and EP1-hf in stable 697 cell lines and for endogenous PBXC and p300 in the parental 697 line at identified common or specific sites in panel E. (H) Motif analyses of E2A-hf– and EP1-hf–occupied regions. %B, percentage of background sequences with motif of total background; %T, percentage of target sequences with motif of total targets.

