Figure 3.
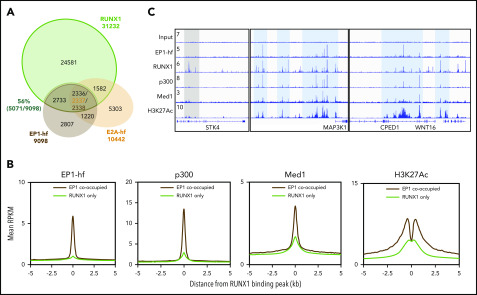
ChIP-seq reveals elevated active marks and factors at E2A-PBX1–bound RUNX1 sites. (A) Venn diagram showing the overlap among E2A-PBX1, E2A, and RUNX1 ChIP-seq peaks. In the triple overlap region, there were 2337 peaks from E2A-hf and 2338 peaks from EP1-hf. (B) Metagene plots showing the averaged ChIP-seq signals for EP1-hf, p300, MED1, and H3K27Ac at identified RUNX1 only or at RUNX1 and E2A-PBX1 cobound sites. (C) ChIP-seq profiles of E2A and E2A-PBX1 in their stable 697 expression lines and those of RUNX1, p300, MED1, and H3K27ac in the parental 697 line at the indicated targets. Blue- and gray-colored boxes show overlap of EP1-hf and RUNX1 peaks.

