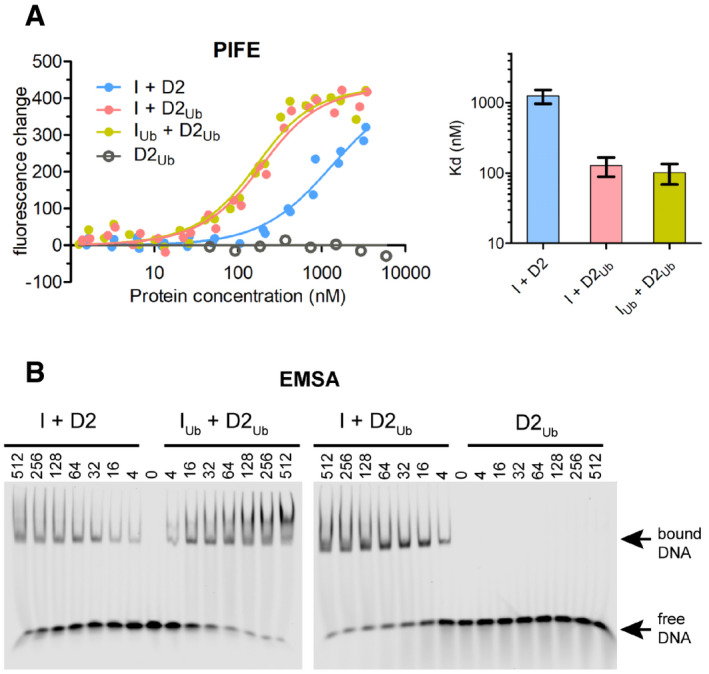
IRDye700‐labelled 32 base pair dsDNA was used to assess ID2‐DNA binding, when neither protein is ubiquitinated (I + D2), when only FANCD2 is ubiquitinated (I + D2
Ub) and when both FANCD2 and FANCI are ubiquitinated (I
Ub +D2
Ub).
-
A
Left: Fluorescence changes of IRDye700‐labelled dsDNA (at 125 nM) when incubated at increasing ID2 (I + D2, IUb + D2Ub, I + D2Ub) or ubiquitinated FANCD2 (D2Ub) concentrations (ranging from 1.3 nM to 5.9 μM). Measurement of fluorescence enhancement for each ID2 complex was conducted for two separately prepared complexes (two technical repeats) and all data points for each protein combination were used in fitting of a one‐site binding model. Right: Bar graph showing mean apparent K
d values calculated from model fitting. Error bars: Asymmetric 95% confidence intervals from non‐linear regression (23–24 data points each).
-
B
Assessment of protein–DNA interactions using electro‐mobility shift assays (EMSAs). IRDye700‐labelled dsDNA (at 2 nM) was incubated with indicated amounts of non/single/double‐ubiquitinated ID2 (His6‐TEV‐V5‐FANCI and FLAG‐FANCD2) protein complexes (I + D2, IUb + D2Ub, I + D2Ub) or ubiquitinated FLAG‐FANCD2 (D2Ub). Mixes were run on non‐denaturing gels, and the resolved free‐ and protein‐bound DNA bands were visualized using an infrared scanner. EMSA gels of ID2 complexes are representative of 3 replicate experiments.
Source data are available online for this figure.

