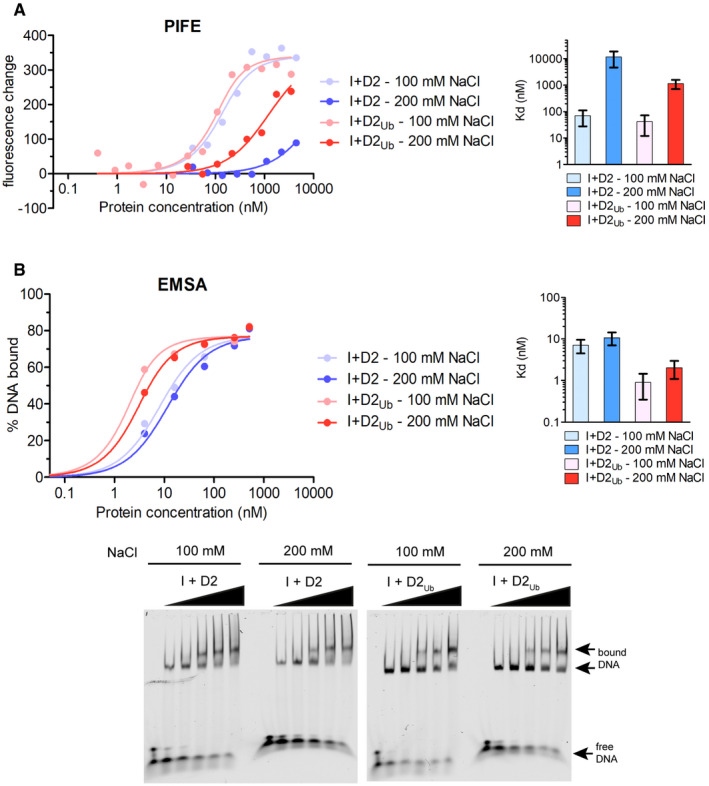
Figure EV1. PIFE and EMSA salt dependence on ID2‐dsDNA and ID2Ub‐dsDNA interactions.

-
A, BID2‐dsDNA and ID2Ub‐dsDNA binding assays at 100 and 200 mM NaCl, using either PIFE (A) or EMSA (B). IRDye700‐labelled dsDNA (125 nM for PIFE or 2 nM for EMSA) was incubated with increasing concentrations of ID2 or ID2Ub, and % DNA binding and fluorescence changes were determined by EMSA and PIFE, respectively. Corresponding values for each concentration were used in fitting of a one‐site binding model. Mean apparent K d values calculated for each complex are shown on the left. Error bars: Asymmetric 95% confidence intervals from non‐linear regression (5–14 data points each).
Source data are available online for this figure.
