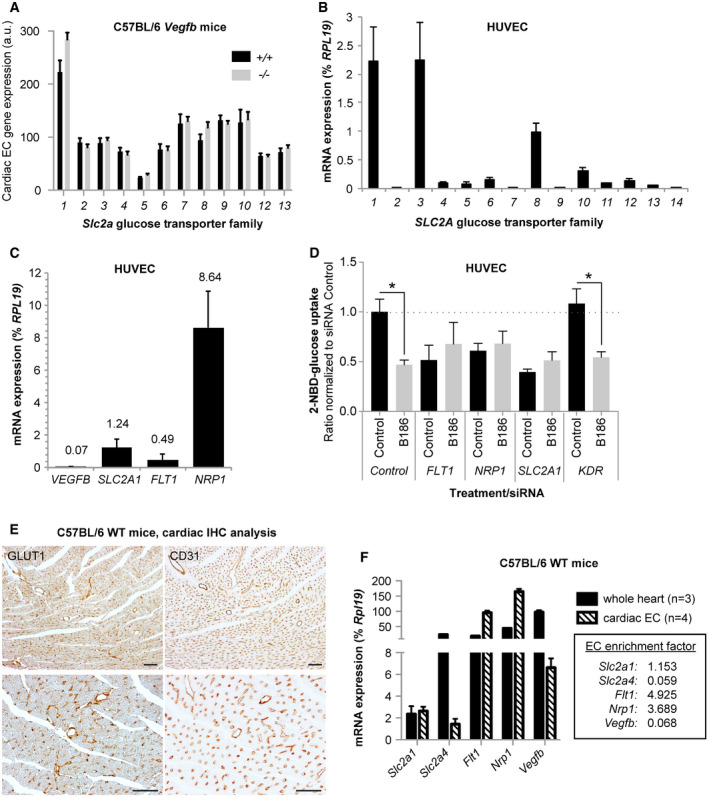
Relative mRNA expression of the Slc2a glucose transporter (GLUT) family members (1‐13) in cardiac ECs derived from Vegfb
+/+ (n = 4) and Vegfb
−/− (n = 4) mice. Data represent normalized PLIER values (mean ± SEM) from microarray analysis performed on n = 4+4 RNA samples (one RNA sample/mouse).
mRNA expression levels of the SLC2A transporter (GLUT) family members (1‐14) in HUVECs. Data presented as mean ± StDev relative to RPL19 expression from 3 independent experiments.
mRNA expression levels of VEGFB, SLC2A1, NRP1, and FLT1 (VEGFR1) in HUVECs. Data presented as mean ± StDev relative to RPL19 expression from 3 independent experiments.
2‐NBD‐glucose uptake in response to 2 h treatment with VEGF‐B186 (B186) in HUVECs exhibiting siRNA‐mediated knockdown of FLT1, NRP1, SCL2A1, KDR (VEGFR2), or control siRNA. Data presented as mean ± SEM from three individual experiments. Statistical evaluation using one‐way ANOVA and Sidak′s multiple comparison test, P‐value: *< 0.05 (comparisons made to respective untreated control).
Representative images of GLUT1 (left panels) and CD31 (right panels) immunohistochemistry performed on consecutive sections from paraffin embedded mouse hearts. Scale bar, 100 μm.
mRNA expression analysis from enriched cardiac endothelial cells (open columns, n = 4 mice) or whole heart (closed columns, n = 3 mice). Data presented as mean ± StDev relative to Rpl19 expression. Enrichment factor is calculated as mean cardiac EC/mean whole heart and presented in the box.
.

