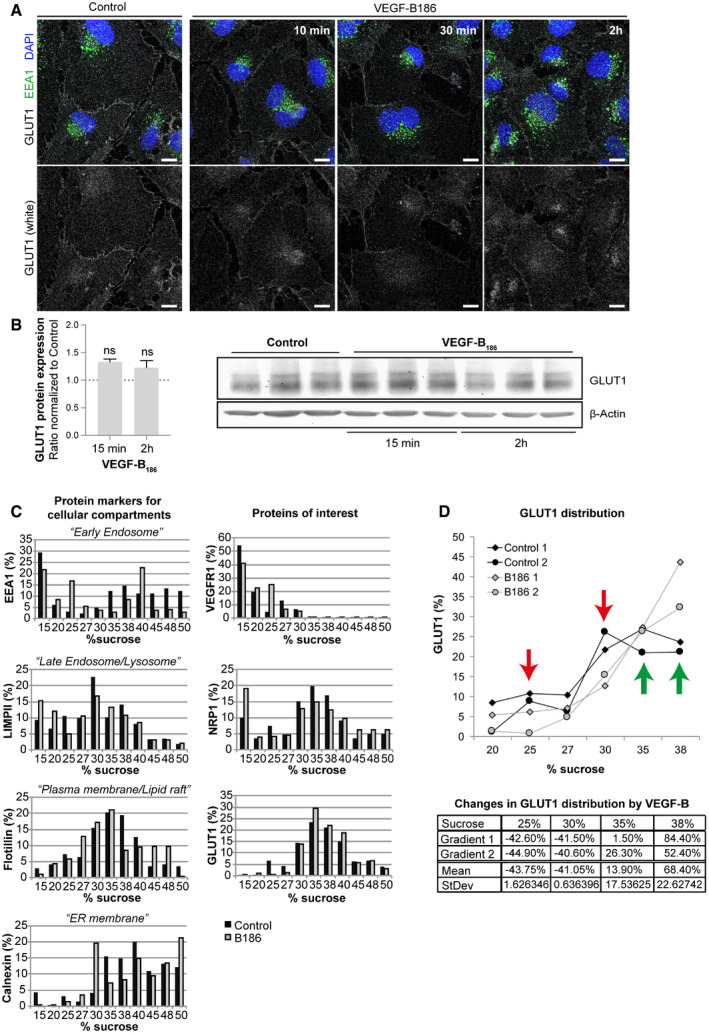
Figure 3. VEGF‐B signaling changes microdomain localization of GLUT1 in the plasma membrane.

- Immunofluorescence labeling of GLUT1 (white), early endosomes (EEA1, green), and nuclei (blue) in HUVECs treated with VEGF‐B186 for 10, 30 min, or 2 h. Scale bar, 10 μm.
- GLUT1 protein expression in HUVECs treated with VEGF‐B186 for 15 min or 2 h. Data presented as mean ± StDev of 3–4 independent experiments relative to β‐Actin expression. Statistical evaluation using t‐test revealed no significant changes. Western blots shown in right panel.
- Sucrose gradient (15–50% sucrose) fractions of HUVEC cellular lysates after 2 h VEGF‐B186 stimulation were analyzed with Western blots shown in Appendix Fig S2. Different cellular sub‐compartments were identified by accumulation of specific protein markers: EEA1 for early endosomes, LIMPII for late endosomes/lysosomes, flotillin for plasma membrane/lipid rafts, and calnexin for endoplasmic reticulum (ER) (left panels). Amount and subcellular distribution of VEGFR1, NRP1, and GLUT1 protein in control or VEGF‐B186 stimulated HUVECs shown in panels to the right. Data represent % protein relative to total protein of interest measured from a representative experiment.
- Quantification of GLUT1 protein in % relative to total measured protein in HUVECs after 2 h VEGF‐B186 stimulation in different sucrose fractions (upper panel). Data from two independent experiments are shown. Green arrows mark fractions with increased GLUT1 content and red arrows mark fractions with decreased GLUT1 content after VEGF‐B186 stimulation. Changes in GLUT1 content in response to VEGF‐B treatment are shown in the table (bottom panel).
