-
A
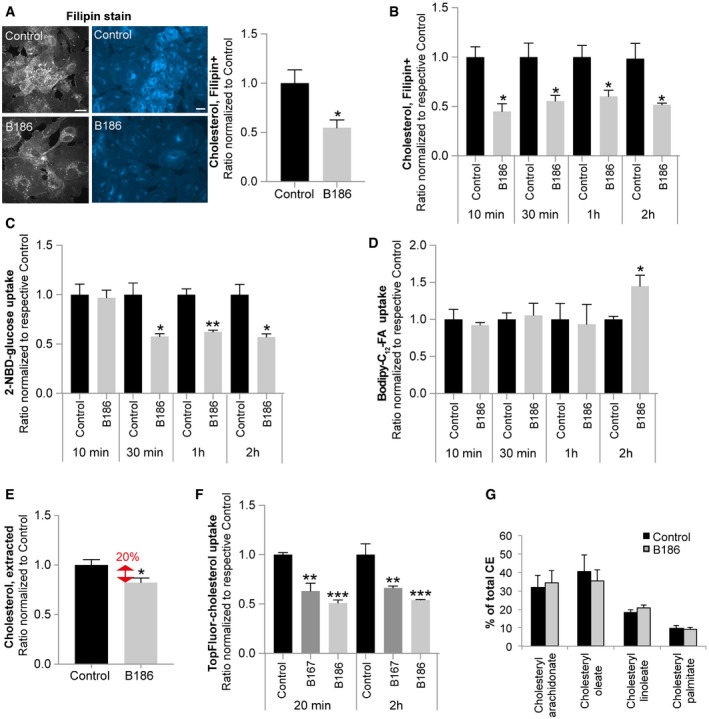
Representative confocal (gray) and epifluorescence (blue) images of filipin staining in HUVECs in response to 2 h VEGF‐B186 stimulation (left panels). Cellular cholesterol content measured by quantification of fluorescent filipin staining. Data presented as mean ± SEM from a representative experiment performed in triplicates. Statistical evaluation using t‐test, P‐value: *< 0.05. Scale bars, 10 μm.
-
B–D
Measurement of cholesterol content (B), glucose uptake (C), and FA uptake (D) in HUVECs after VEGF‐B186 stimulation for different time points. Data presented as mean ± SEM from representative experiments performed in triplicates. Statistical evaluation using t‐test, P‐value: *< 0.05, **< 0.01, ***< 0.001 (compared to respective control).
-
E
Colorimetric quantification of non‐esterified cholesterol extracted from HUVECs stimulated with VEGF‐B186 for 20 min. Data are presented as mean ± SEM of three individual experiments. Statistical evaluation using t‐test, P‐value: *< 0.05.
-
F
Uptake of a fluorescent cholesterol tracer (TopFluor) in HUVECs after VEGF‐B186 stimulation for 20 min or 2 h. Data presented as mean ± SEM from a representative experiment performed in triplicates. Statistical evaluation using one‐way ANOVA and Dunnett's multiple comparison test, P‐value: **< 0.01, ***< 0.001 (compared to respective untreated control).
-
G
Quantification of the major cholesteryl ester (CE) species in HUVECs after VEGF‐B186 stimulation for 20 min, analyzed by lipid mass spectrometry. Data presented as mean ± StDev of an experiment performed in triplicates.
.

