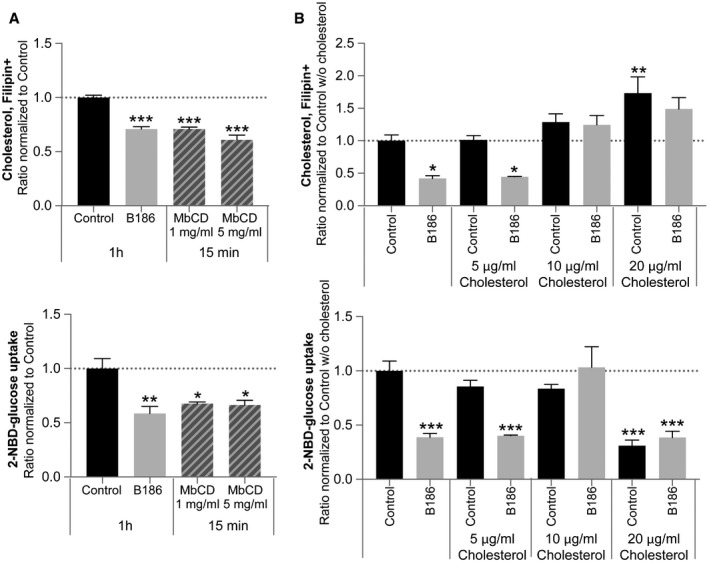
Figure 5. Cholesterol content and glucose uptake are tightly linked in ECs.

- Measurement of cellular cholesterol content (upper panel) and glucose uptake (lower panel) in HUVECs treated with VEGF‐B186 for 1 h or after 15‐min treatment with cholesterol‐extracting methyl‐beta‐cyclodextrin (MbCD). Data are presented as mean ± SEM from a representative experiment performed in triplicates. Statistical evaluation using one‐way ANOVA and Dunnett's multiple comparison test, P‐value: ***< 0.001 (compared to untreated control).
- Measurement of cellular cholesterol content (upper panel) and glucose uptake (lower panel) in HUVECs treated with VEGF‐B186 for 15 min alone or supplemented with soluble methyl‐beta‐cyclodextrin complexed with cholesterol (5, 10 or 20 μg/ml cholesterol). Data presented as mean ± SEM from a representative experiment performed in triplicates. Statistical evaluation using one‐way ANOVA and Dunnett's multiple comparison test, P‐value: *< 0.05, **< 0.01, ***< 0.001 (compared to control w/o cholesterol).
