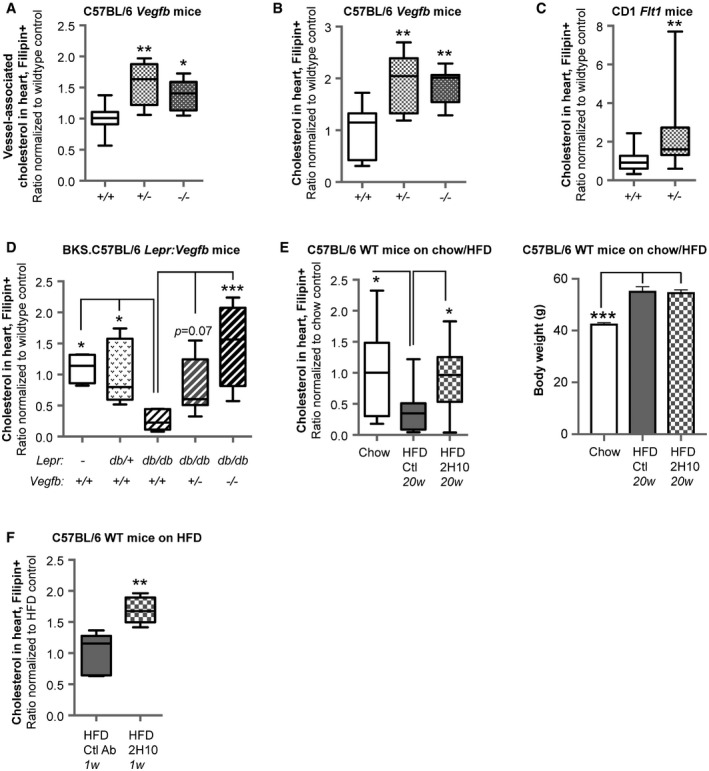
Quantification of non‐esterified cholesterol content by means of filipin staining in the blood vessel compartment (podocalyxin+) in hearts of 15‐week‐old male C57BL/6 Vegfb
+/− (n = 5) and Vegfb
−/− mice (n = 7), normalized to wild‐type (Vegfb
+/+) mice (n = 8). Data presented as box‐and‐whisker plots. Boxes represent lower/upper quartiles with the median values indicated with a horizontal line. Whiskers represent min–max values. Statistical evaluation using one‐way ANOVA and Dunnett's multiple comparison test, P‐value: *< 0.05, **< 0.01 (compared to Vegfb
+/+ mice).
Quantification of non‐esterified cholesterol content by means of filipin staining in hearts of 15‐week‐old male C57BL/6 Vegfb
+/− (n = 5) and Vegfb
−/− (n = 7) mice, normalized to wild‐type (Vegfb
+/+) mice (n = 8). Data presented as box‐and‐whisker plots. Boxes represent lower/upper quartiles with the median values indicated with a horizontal line. Whiskers represent min–max values. Statistical evaluation using one‐way ANOVA and Dunnett's multiple comparison test, P‐value: **< 0.01 (compared to Vegfb
+/+ mice).
Quantification of non‐esterified cholesterol content by means of filipin staining in hearts of 25‐week‐old male CD1 Flt1
+/lacz (n = 20) mice, normalized to wild‐type CD1 (Flt1
+/+) mice (n = 16). Data presented as box‐and‐whisker plots. Boxes represent lower/upper quartiles with the median values indicated with a horizontal line. Whiskers represent min–max values. Statistical evaluation using t‐test, P‐value: **< 0.01.
Quantification of non‐esterified cholesterol content by means of filipin staining in hearts of 12‐ to 16‐week‐old male C57BL/6 wild‐type (Vegfb
+/+) (n = 4), BKS.C57BL/6 db/+ Vegfb
+/+ (n = 8), db/db Vegfb
+/− (n = 10), and db/db Vegfb
−/− (n = 4) mice, normalized to db/db Vegfb
+/+ (n = 6) mice. Data presented as box‐and‐whisker plots. Boxes represent lower/upper quartiles with the median values indicated with a horizontal line. Whiskers represent min–max values. Statistical evaluation using one‐way ANOVA and Dunnett's multiple comparison test, P‐value: *< 0.05, ***< 0.001 (compared to db/db Vegfb
+/+ mice).
Left panel: Quantification of non‐esterified cholesterol content by means of filipin staining in hearts of C57BL/6 male mice after 25 weeks on HFD, long‐term treated with isotype control (n = 17) or VEGF‐B blocking antibody (2H10, n = 17) initiated after 5 weeks on HFD, normalized to age‐matched mice on chow diet (n = 10). Data presented as box‐and‐whisker plots. Boxes represent lower/upper quartiles with the median values indicated with a horizontal line. Whiskers represent min–max values. Right panel: Body weights (mean ± SEM) of HFD (n = 17+17) and chow fed littermate mice (n = 10). Statistical evaluation using one‐way ANOVA and Dunnett's multiple comparison test, P‐value: *< 0.05, ***< 0.001 (compared to HFD control mice).
Quantification of non‐esterified cholesterol content by means of filipin staining in hearts of mice on HFD for 17 weeks followed by treatment for 1 week with 2H10 antibody (n = 5) compared to control antibody treated mice (n = 5). Data presented as box‐and‐whisker plots. Boxes represent lower/upper quartiles with the median values indicated with a horizontal line. Whiskers represent min–max values. Statistical evaluation using t‐test, P‐value: **< 0.01.
.

