-
A, B
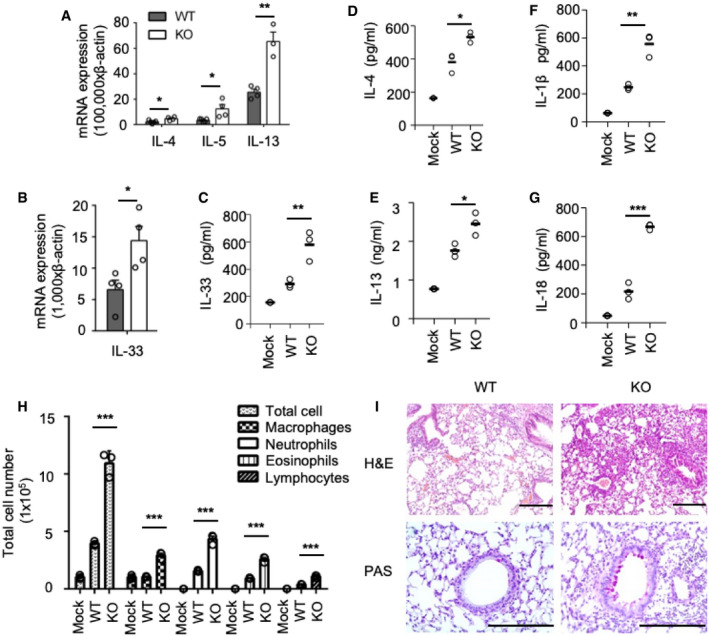
Quantitative RT–PCR analysis of mRNA encoding various cytokines (IL‐4, IL‐5, IL‐13, IL‐33) in lung samples from wild‐type (WT) and EphA2‐knockout (KO) mice (n = 4 per strain) sensitized with ova; results presented relative to β‐actin. Shown is mean ± SD.
-
C
ELISA of IL‐33 in lung tissue homogenate samples from wild‐type (WT) and EphA2‐knockout (KO) mice (n = 3 per strain) sensitized with ova.
-
D–G
ELISA of IL‐4, IL‐13, IL‐1β, and IL‐18 in lung tissue homogenate samples from wild‐type (WT) and EphA2‐knockout (KO) mice (n = 3 per strain) sensitized with ova.
-
H
Cell number and category of BALF samples from wild‐type (WT) and EphA2‐knockout (KO) mice (n = 3 per strain) sensitized with ova. Shown is mean ± SD.
-
I
H&E staining and PAS staining of lung sections from wild‐type (WT) and EphA2‐knockout (KO) mice sensitized with ova. Scale bars represent 200 μm.
Data information: Each symbol represents an independent experiment; small horizontal lines indicate the average of triplicates. *
P < 0.05, **
P < 0.01, and ***
P < 0.001 (unpaired
t‐test). Data represent three or four independent biological replicates.

