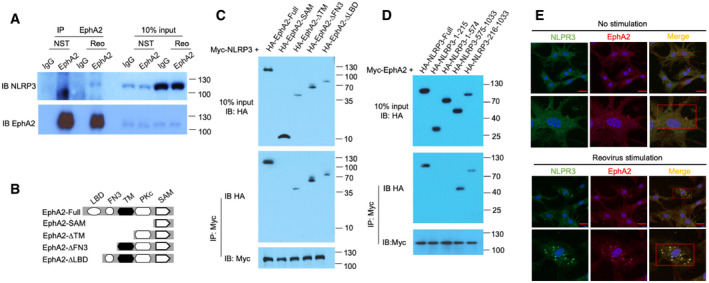
Immunoblot analysis of proteins precipitated with anti‐EphA2 or IgG (control) from whole‐cell lysates of AECs from wild‐type mice stimulated with reovirus (MOI = 5) for 3 h. Input, 10% of the AEC lysate.
Full‐length EphA2 and serial truncations of EphA2 with deletion of various domains.
The indicated plasmids of HA‐tagged full‐length EphA2 and EphA2 truncation mutants were respectively transfected into HEK293T cells along with Myc‐tagged NLRP3, and then, cell lysates were immunoprecipitated with anti‐Myc antibody, followed by Western blot analysis with anti‐HA antibody and anti‐Myc antibody.
The indicated plasmids of HA‐tagged full‐length NLRP3 and NLRP3 truncation mutants were respectively transfected into HEK293T cells along with Myc‐tagged EphA2, and then, cell lysates were immunoprecipitated with anti‐Myc antibody, followed by Western blot analysis with anti‐HA antibody and anti‐Myc antibody.
Colocalization of endogenous EphA2 and NLRP3 in AECs. AECs were unstimulated or stimulated with reovirus for 2 h before confocal microscopy analysis. EphA2 was stained with rabbit anti‐EphA2 (1:500), followed by Alexa Fluor 594 goat anti‐rabbit secondary antibody (red), while NLRP3 was stained with mouse anti‐NLRP3 (1:500), followed by Alexa Fluor 488 goat anti‐mouse secondary antibody (green). DAPI (4′,6‐diamidino‐2‐phenylindole) served as the nuclei marker (blue). Scale bars represent 20 μm. The Pearson correlation coefficient and the Mander overlap coefficient in the upper red box are 0.5, and 0.95, respectively, and in the lower red box are 0.78 and 0.94, respectively.
Data information: The position of protein markers (shown in kDa) is indicated on the right‐hand side. Data are representative of three independent biological replicates.

