-
A
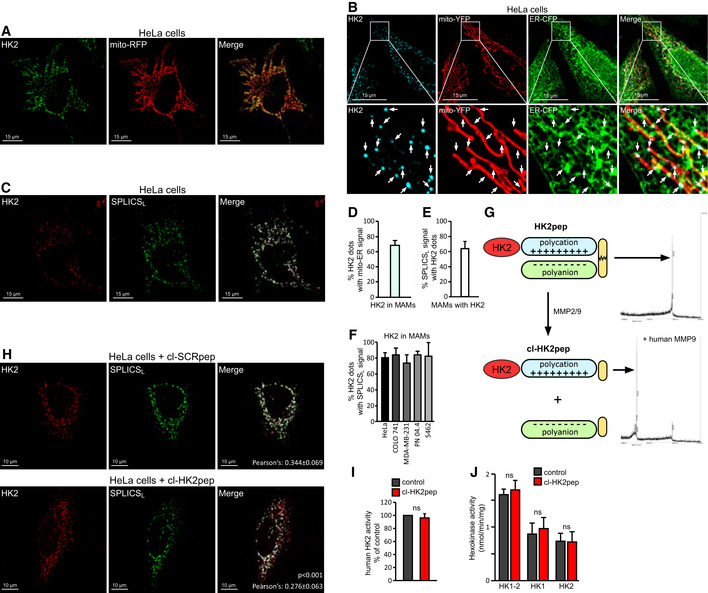
Immunofluorescence staining of HK2 with an AlexaFluor488‐conjugated antibody in HeLa cells expressing mitochondria‐targeted RFP. Yellow signals in the merge analysis indicate mitochondrial localization of HK2. Scale bar: 15 μm.
-
B
Immunofluorescence staining of HK2 with a secondary AlexaFluor555‐conjugated antibody in HeLa cells expressing both mitochondria‐targeted YFP and ER‐targeted CFP. The merged white signal indicates MAM localization of HK2 and is quantified in the bar graph on the right (n = 24). Image magnifications are shown in the lower part of the panel; arrows indicate HK2 dots in mito‐ER contact sites. Scale bar: 15 μm.
-
C
Fluorescence co‐staining of HK2 and split‐GFP‐based probe for ER‐mitochondria contacts (SPLICSL) on HeLa cells; HK2 is revealed with a secondary AlexaFluor555‐conjugated antibody, and the merged signal is white. Scale bar: 15 μm.
-
D
Quantification of panel B experiment showing the percentage of HK2 dots that merge with MAMs in HeLa cells (n = 24 cells analyzed from three independent experiments; mean ± SD).
-
E
Quantification of panel C experiment showing the percentage of SPLICSL dots positive for HK2 in HeLa cells (n = 10 cells analyzed from three independent experiments; mean ± SD).
-
F
Percentage of HK2 dots positive for SPLICSL in HeLa, COLO 741, MDA‐MB‐231, PN 04.4, and S462 cells (n ≥ 6 cells for each cell line; mean ± SD).
-
G
Functional unit composition of HK2pep (left); the HK2‐targeting sequence is in red; the polycation and polyanion stretches are in light blue and light green, respectively; the MMP2/9 target sequence is in yellow. On the right, mass spectrometry profile of HK2pep before and after incubation (cl‐HK2pep) with human MMP9.
-
H
HK2 displacement from HeLa MAMs after a 2 min treatment with cl‐HK2pep is shown by loss of merging signal analyzed as in (C). cl‐SCRpep is used as a negative control, and Pearson's co‐localization coefficient is indicated in figure (cl‐SCRpep n = 26 cells; cl‐HK2pep n = 24 cells; P < 0.001 with a Student's t‐test). Scale bar: 10 μm.
-
I, J
Effect of cl‐HK2pep on glucose phosphorylation by human recombinant HK2 (I) or in 4T1 cell extracts (J), where both total hexokinase activity and HK1/HK2 specific activities are measured.

