-
A–F
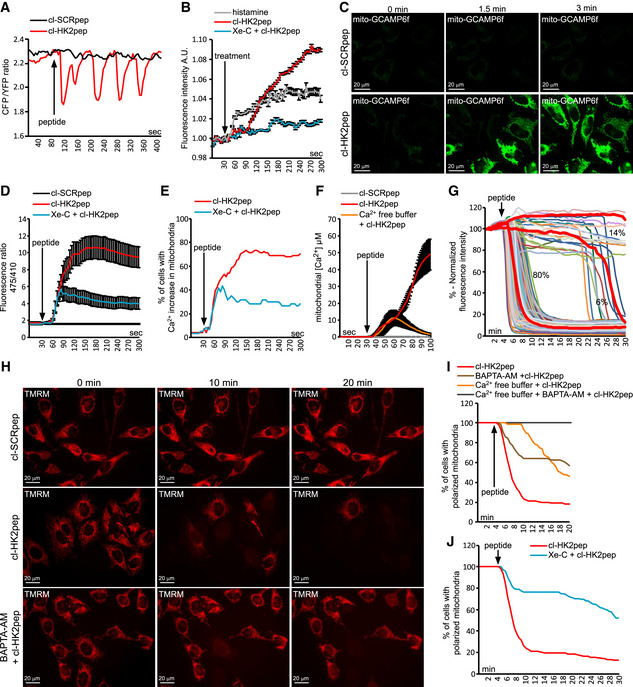
Effect of cl‐HK2pep on cellular Ca2+ dynamics and IP3 levels. ER Ca2+ levels are measured by the FRET‐based, D4ER fluorescent probe expressed in the lumen of ER (A); IP3 levels are assessed with the GFP‐PHD probe; histamine (100 μM) is used as a positive control for IP3 generation; data are reported as mean of fluorescent signals ± SEM (n = 3 independent experiments; B); changes in mitochondrial Ca2+ levels are recorded (C; scale bar: 20 μm) and quantified using the GCAMP6f sensor (in D, as mean of 475/410 nm ratio; signal ± SEM of at least five independent experiments and more than 20 cells analyzed), in (E) as percentage of cells with increased Ca2+ in mitochondria, with a threshold 475/410 ratio for positivity > 3; baseline mean ratio = 1.84 ± 0.54) or with mitochondria‐targeted aequorin (F, where data are reported as mean of [Ca2+] ± SEM of 3 independent experimental days).
-
G–J
Effect of cl‐HK2pep treatment on mitochondrial membrane potential assessed with the TMRM probe. Kinetic experiments (G, single cell analysis, n = 216 cells analyzed in at least 10 independent experiments; H, representative field; scale bar: 20 μm) are quantified (I and J; TMRM fluorescence is normalized to initial value and expressed in percentage for each time point, with a depolarization threshold placed at 40% of initial value).
Data information: Experiments throughout the figure are carried out on HeLa cells; cl‐SCRpep, negative control of cl‐HK2pep (2 μM each). Where indicated, cells are kept in Ca
2+‐free medium plus 500 μM EGTA with or without 10 μM BAPTA‐AM; Xe‐C is Xestospongin C, which selectively inhibits IP3R at the 5 μM concentration used here
46.

