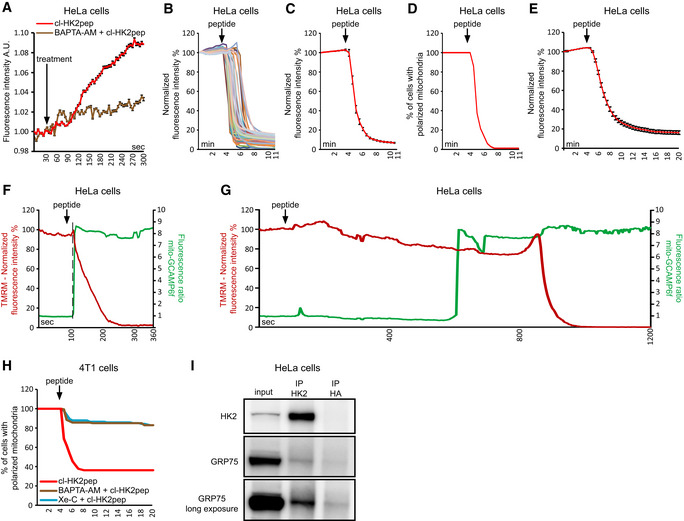
Figure EV3. Related to Fig 2. Kinetics of cl‐HK2pep‐induced mitochondrial depolarization.

-
AIP3 levels are assessed with the GFP‐PHD probe in presence or not of 10 μM BAPTA‐AM; data are reported as mean of fluorescent signals ± SEM (n = 3 independent experiments)
-
B–EChanges in mitochondrial membrane potential following cl‐HK2pep treatment assessed with TMRM as in Fig 2G. In B and C, HeLa cells are treated with 5 μM cl‐HK2pep; mitochondrial depolarization is shown for single cells (B; n = 60 cells analyzed from three independent experimental days) or as an averaged trace (C; n = 60 cells analyzed from three independent experimental days). TMRM signal is normalized to the initial value and expressed in percentage for each time point. D, TMRM positive HeLa cells are expressed in percentage (threshold count: fluorescence signal > 40% of initial value; n = 60 cells analyzed from three independent experimental days). E, HeLa cells are treated with 2 μM cl‐HK2pep (n = 216 cells analyzed from 10 independent experimental days; fluorescence mean ± SEM) and analyzed as in C.
-
F, GChanges in Ca2+ levels and membrane potential in HeLa cell mitochondria following treatment with 2 μM cl‐HK2pep. Measurements are performed in parallel on cells expressing mito‐GCAMP6f and loaded with TMRM. Two different single representative cell traces are shown, characterized by fast (F) or slow (G) mitochondrial depolarization following peptide treatment (three different experimental days). The dotted line indicates the time point in which mito‐GCAMP6f ratio increases from the basal.
-
HMitochondrial depolarization in 4T1 cells treated with 2 μM cl‐HK2pep (n = 129) is analyzed as in C. Where indicated, BAPTA‐AM (10 μM; n = 147) or Xe‐C (5 μM; n = 141) are added as in Fig 2B 1 h before experiment.
-
ICo‐immunoprecipitation between HK2 and GRP75.
