
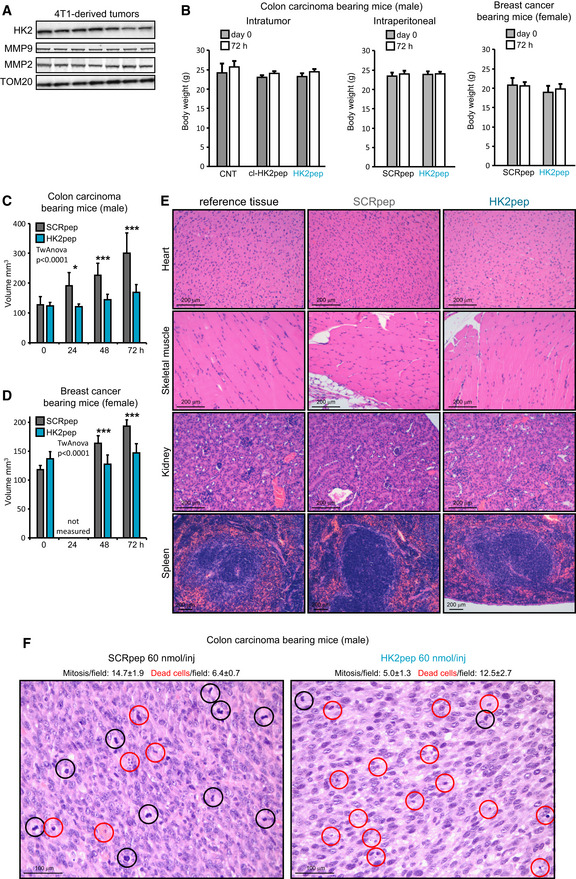
Figure EV5. Related to Fig 5. Analysis of mouse samples following xenograft injection of tumor cells and peptide treatment.
-
AWestern immunoblot analysis of MMP2 and MMP9 expression in neoplasms formed by 4T1 cells in mouse allografts; TOM20 is used as loading control.
-
BBody weight measurements of mice from experiments reported in Fig 5F–H (from left to right, respectively—mean ± SD; F: CNT n = 4; cl‐HK2pep n = 5; HK2pep n = 5 mice; G: SCRpep n = 6; HK2pep n = 7 mice; H: SCRpep n = 5; HK2pep n = 7 mice).
-
C, DEffect of HK2‐targeting on in vivo neoplastic growth. Intraperitoneal administration of HK2pep (C; 5 injections of 60 nmol peptide every 12 h; SCRpep n = 6; HK2pep n = 7) reduce neoplastic growth; the same effect is observed on allografts of breast carcinoma 4T1 cells (D; 5 injections of 60 nmol peptide every 12 h; SCRpep n = 5; HK2pep n = 7) in Balb/c female mice. A two‐way ANOVA is performed (P < 0.0001‐HK2pep versus SCRpep during the time); Bonferroni post‐test in the graphs *P < 0.05; ***P < 0.001.
-
ERepresentative hematoxylin/eosin staining on samples from heart, skeletal muscle, kidney, and spleen obtained from mice‐bearing CT26 tumors after peptide treatment as in Fig 5G. Scale bar: 200 μm.
-
FCell death and mitosis analyses on tumor slices from Fig 5G experiment. Dead or mitotic cells were counted on samples stained with hematoxylin/eosin (SCRpep versus. HK2pep; mitotic cells count: P < 0.001 with Student's t‐test; dead cell count: P < 0.05 with Student's t‐test; at least 10 different fields where counted for each tumor samples). Scale bar: 100 μm.