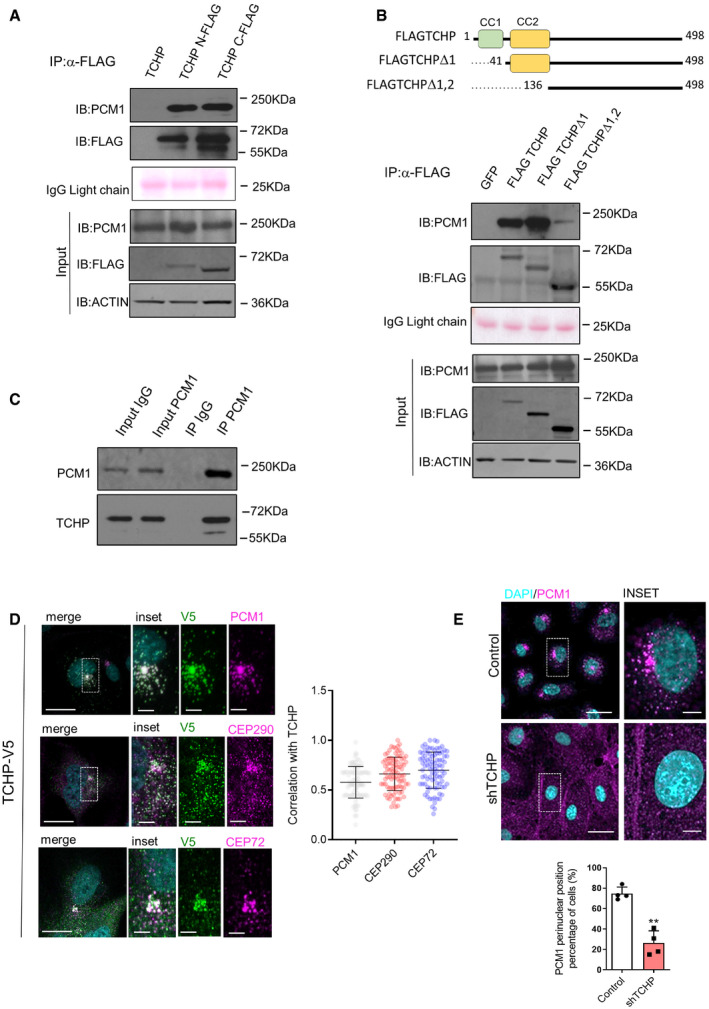
Figure 1. TCHP interacts directly with PCM1.

-
A, B(A) Immunoblot analysis showed HEK293 transfected for 48 h with expression vectors for TCHP, and FLAG‐TCHP at N‐ and C‐terminal. (B) Immunoblot analysis showed HEK293 transfected for 48 h with expression vectors for TCHP‐FLAG C‐terminal or constructs with deletions of the coiled‐coil domain 1 (TCHP Δ1) and 2 (TCHP Δ2), as indicated in the scheme. For (A and B), total lysates were immunoprecipitated with anti‐FLAG antibodies, and blots were probed sequentially with anti‐PCM1, anti‐FLAG and anti‐ACTIN antibodies. IgG light chains are indicated with Red Ponceau staining. The input totals were analysed by parallel immunoblotting as a control for the level of expression.
-
CAnti‐PCM1 immunoprecipitation from HUVECs cells and TCHP and PCM1 immunoblot.
-
DCo‐localization of TCHP‐V5 and centriolar satellite proteins. HUVECs were transduced with TCHP‐V5 lentivirus and stained for anti‐PCM1, anti‐CEP290, anti‐CEP72 and anti‐V5 antibodies. Scale bars, 25 and 5 μm in the inset. Right panel: the two‐channel intensity correlation of pixels corresponding to regions identified with TCHP‐V5 and satellite markers (n = 90 cells; Pearson co‐localization coefficient).
-
ETCHP knock‐down or control cells were stained for anti‐PCM1 antibody. Panel below: quantification (n = 50 cells; unpaired t‐test; **P = 0.004 vs. control). Scale bars, 50 and 5 μm in the inset.
