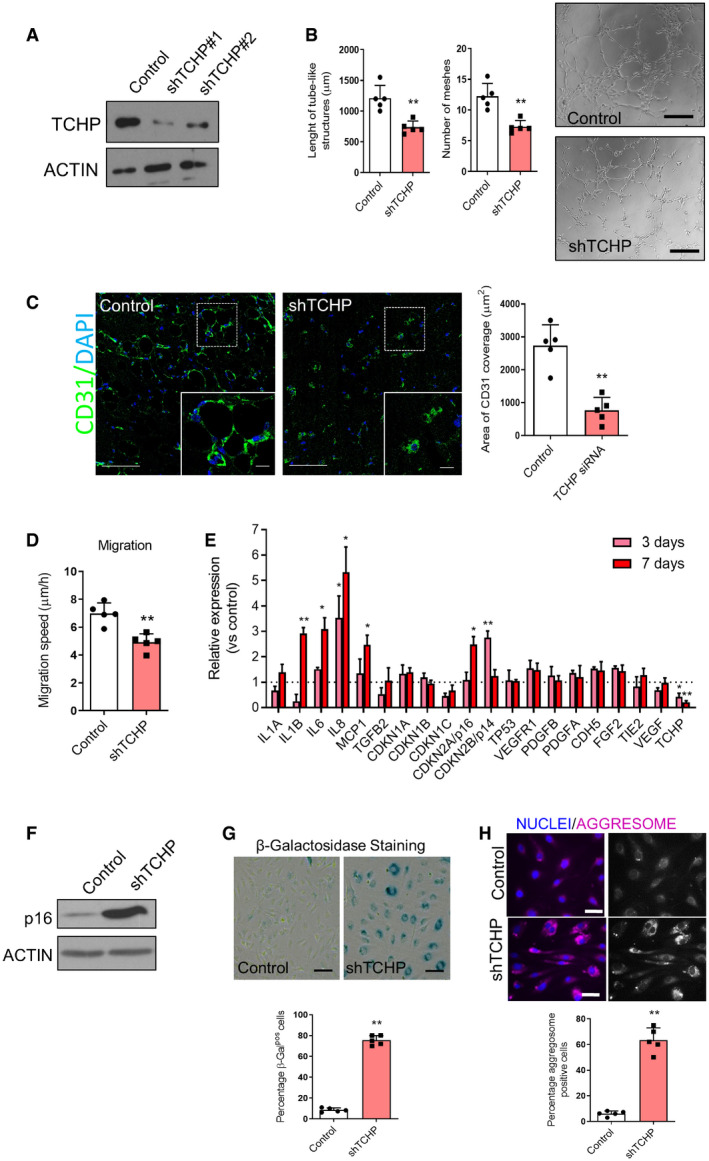
Western blot anti‐TCHP following knock‐down of TCHP.
Endothelial network formation on Matrigel was analysed by quantification of the total length of tube‐like structures and number of meshes (unpaired t‐test, **P = 0.0018 and **P = 0.0014 vs. control, respectively); right panels, representative microphotographs from Matrigel assay; scale bars, 100 μm.
Left panels: representative images are showing the new microvessels positive for CD31 (green), in the implanted plugs. Scale bars, 50 and 25 μm for the inset. Right panel: quantification of the area of CD31 coverage in the Matrigel plugs mixed with TCHP siRNA or control oligos at 21 days after implantation; (n = 5 mice per group, unpaired t‐test, **P = 0.0004 vs. control).
Effect of TCHP knock‐down on HUVEC migration speed measured by electric cell‐substrate impedance sensing (ECIS) (unpaired t‐test, **P = 0.0013 vs. control).
Relative mRNA levels of TCHP and subset of genes. Graphs represent transcripts measured at 3 and 7 days post‐TCHP knock‐down (unpaired t‐test vs. control; IL‐1β: **P = 0.0048; IL‐6: *P = 0.015; IL‐8: *P = 0.0365—3 days; *P = 0.0168—7 days; MCP1: *P = 0.0223; p16: *P = 0.0133; p14: **P = 0.0073; TCHP: *P = 0.0185—3 days; *P = 0.0018—7 days).
Western Blot anti‐p16.
β‐Galactosidase activity as reveal by the chromogenic β‐Gal substrate X‐Gal. Scale bars 25 μm. Lower panel: quantification (unpaired t‐test, **P < 0.0001 vs. control).
Aggresome staining and quantification of protein aggregates; scale bars, 25 μm. Lower panel: quantification (unpaired t‐test, **P < 0.0001 vs. control).
Data information: Statistical analyses were performed on at least three independent experiments. Data are represented as mean ± SD.

