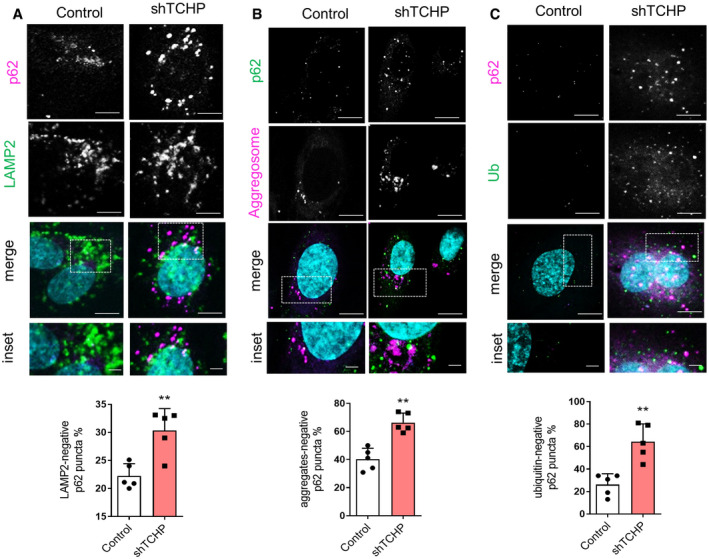
Figure EV3. Analysis of p62 localization in TCHP knock‐down cells.

-
A–CCo‐localization between (A), LAMP2 and p62, (B), aggregates and p62 and (C), ubiquitinated proteins and p62 in TCHP knock‐down and control cells. Scale bars, 25 and 2 μm in the inset. Lower panels: quantification of the above panels (n = 80 cells, unpaired‐test; A: **P = 0.0038 vs. control; B: **P = 0.0005 vs. control; C: **P = 0.0017 vs. control).
