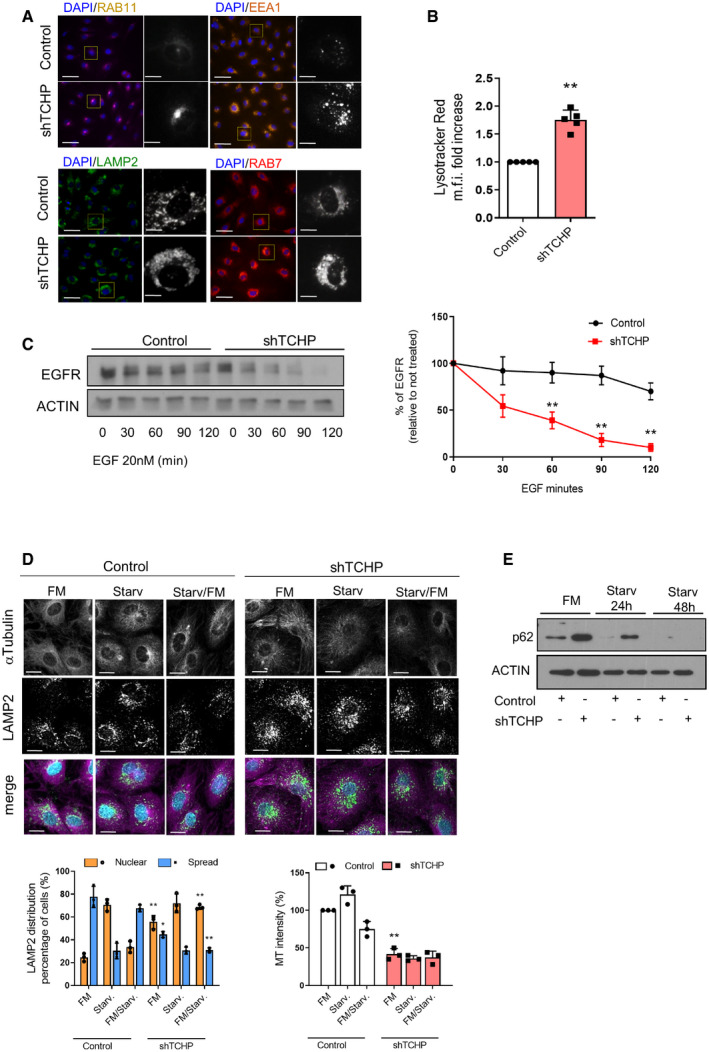
Immunofluorescence for recycling (RAB11), early (EEA1), late (RAB7) endosomes and lysosome (LAMP1/2); scale bars, 25 μm.
Quantitative analysis of LysoTracker Red by flow cytometry (unpaired t‐test; **P = 0.0007 vs. control).
Representative Western blot showing epidermal growth factor receptor (EGFR) levels during a pulse‐chase experiment with EGF (20 nM) for the indicated times. Right panel: quantification, (n = 3, one‐way ANOVA; EGF 60 min. **P = 0.0007 EGF 90 and 120 min. **P < 0.0001 vs. control time 0).
Representative images showed TCHP knock‐down and control cells stained for LAMP2 and αTubulin. Cells were analysed in growing medium (FM), after 2‐h starvation (Starv.) or after 2‐h starvation and replenishment of growing medium for 2 h (FM/Starv.) Scale bars, 10 μm. MT network was quantified as α‐Tubulin intensity. LAMP2 radial integrated fluorescence intensity was used to quantify the distribution of lysosomes. The graph shows the percentage of cells showing cytoplasmic spread or perinuclear lysosome distribution (n = 20 cells, one‐way ANOVA; nuclear: **P = 0.0031 vs. control FM, **P = 0.0026 vs. control FM/Starv. Spread: *P = 0.0195 vs. control FM, **P = 0.0001 vs. control FM/Starv) and MT intensity (n = 20 cells, one‐way ANOVA; **P = 0.0056 vs. control FM).
Western blot for anti‐p62 in TCHP knock‐down and control cells after serum starvation.
Data information: Statistical analyses were performed on at least three independent experiments. Data are represented as mean ± SD.

