-
A
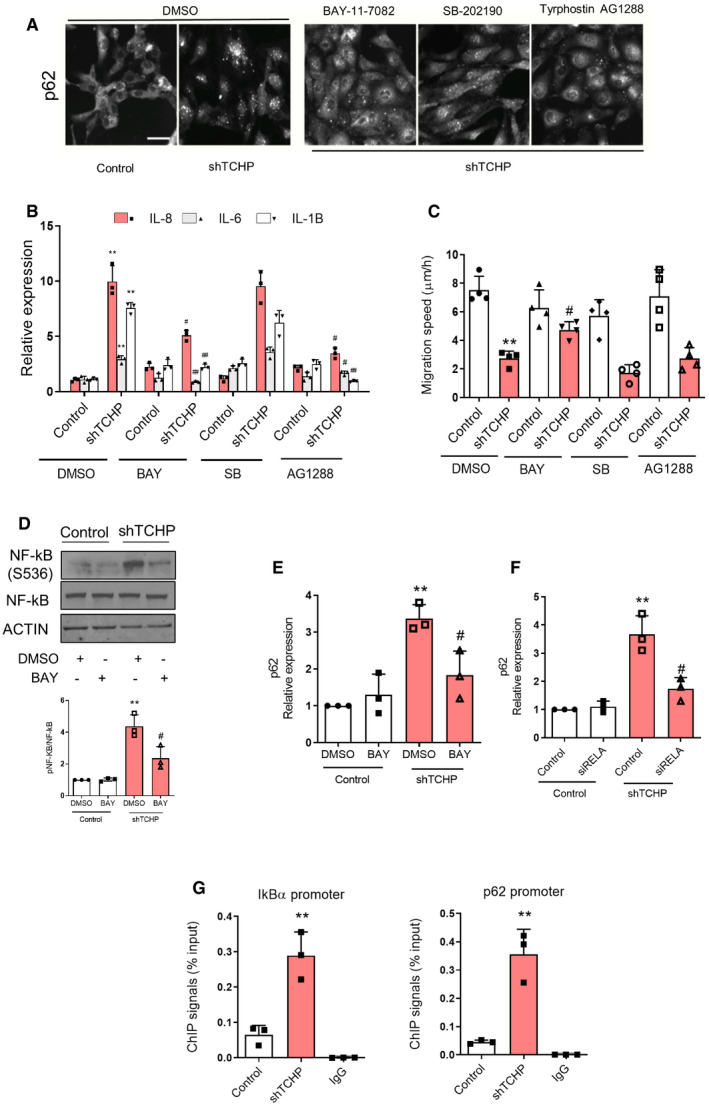
Representative images for p62 of control and TCHP knock‐down HUVECs treated with BAY11‐7082 (300 nM) or TYRPHOSTIN AG1288 (300 nM) or SB202190 (300 nM) or vehicle (DMSO) for 48 h. Scale bars, 50 μm.
-
B, C
(B) Expression of IL‐6, IL‐8 and IL‐1β (one‐way ANOVA; IL‐8: **P = 0.008 vs. control DMSO; #
P = 0.0198 (BAY) #
P = 0.01 (AG) vs. shTCHP DMSO; IL‐6: **P = 0.0023 vs. control DMSO; #
P = 0.0063 (BAY) #
P = 0.0108 (AG) vs. shTCHP DMSO; IL‐1β: **P = 0.0011 vs. control DMSO; #
P = 0.0004 (BAY) #
P = 0.0015 (AG) vs. shTCHP DMSO) and (C), migration speed was measured (one‐way ANOVA; **P = 0.0003 vs. control DMSO; #
P = 0.0451 vs. shTCHP DMSO).
-
C
Western blot analysis for anti‐phosphor‐NF‐κB (S536), total NF‐κB, in TCHP knock‐down and control cells treated with BAY or vehicle. Below panel: quantification (one‐way ANOVA; **P = 0.0014 vs. control DMSO; #
P = 0.0293 vs. shTCHP DMSO).
-
D
p62 expression in TCHP knock‐down and control cells treated with BAY or vehicle (one‐way ANOVA; **P = 0.0004 vs. control DMSO; #
P = 0.0243 vs. shTCHP DMSO).
-
E
p62 expression in TCHP knock‐down and control cells treated with siRELA or control (one‐way ANOVA; **P = 0.0023 vs. control siRNA; #
P = 0.0127 vs. shTCHP siRELA).
-
F
ChIP‐qPCR analysis confirms the of NF‐κB p65 enrichment to IκBα and p62 promoter in TCHP knock‐down cells (unpaired t‐test; **P = 0.0057 and **P = 0.0037 vs. control, respectively).
Data information: Statistical analyses were performed on at least three independent experiments. Data are represented as mean ± SD.

