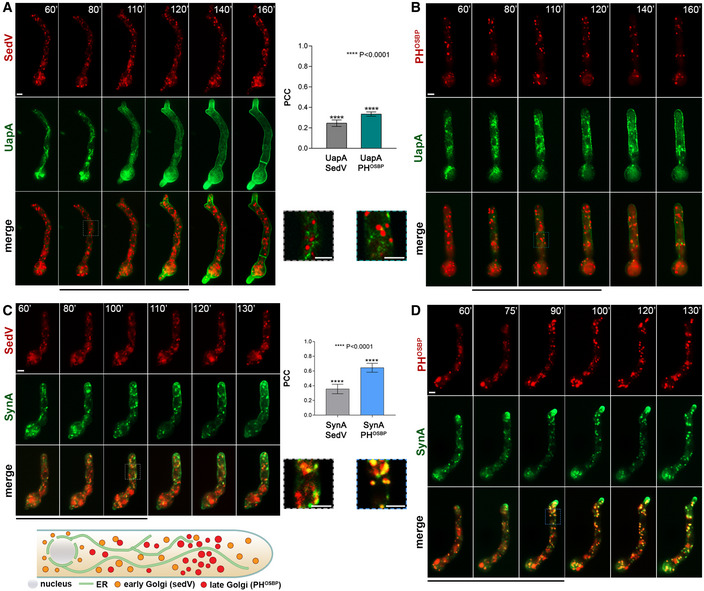
Figure 2. Neosynthesized UapA does not co‐localize with Golgi markers.

-
A, BCo‐localization analysis of neosynthesized alcA p‐UapA‐GFP with early (SedV) or late (PHOSBP) markers, respectively, tagged with mCherry or mRFP. Images show single hyphal cells. For conditions of transcriptional derepression, see Materials and Methods. Quantification of co‐localization was performed by calculating Pearson's correlation coefficient (PCC). One sample t‐test was performed to test the significance of differences in PCCs. Biological/technical replicates:2/9 for alcA p‐UapA‐GFP mCherry‐SedV and 2/8 for alcA p‐UapA‐GFP mRFP‐PHOSBP. For the definition of the two categories of replicates, see Materials and Methods. Results of quantification, shown on the middle, suggest that there is no significant overlapping fluorescent signal of UapA with SedV (PCC = 0.25 ± 0.09, P < 0.0001) or with PHOSBP (PCC = 0.34 ± 0.06, P < 0.0001), as PCC values close to 0.2–0.3 are also commonly obtained when distinct compartments (e.g. ER and early Golgi or early and late Golgi) are followed with different fluorophores. Scale bars: 2 μm.
-
C, DCo‐localization analysis of neosynthesized alcA p‐GFP‐SynA, used as a conventional cargo that traffics through the Golgi, with early (SedV) or late (PHOSBP) markers tagged with mCherry or mRFP, respectively. Images show single hyphal cells. For conditions of transcriptional derepression, see Materials and Methods. Quantification of co‐localization and statistical analysis was performed as in (A, B). Biological/technical replicates: 2/10 for each strain. Statistical analysis showed significant co‐localization of SynA with the late Golgi marker (PCC = 0.67 ± 0.04, P < 0.0001), but not with early Golgi marker (PCC = 0.37 ± 0.06, P < 0.0001). An explanation for lack of co‐localization of SynA with SedV is given in the text. Scale bars: 2 μm. The cartoon at the bottom depicts the localization of early or late markers as established here in several previous studies (see 20, 21).
Source data are available online for this figure.
