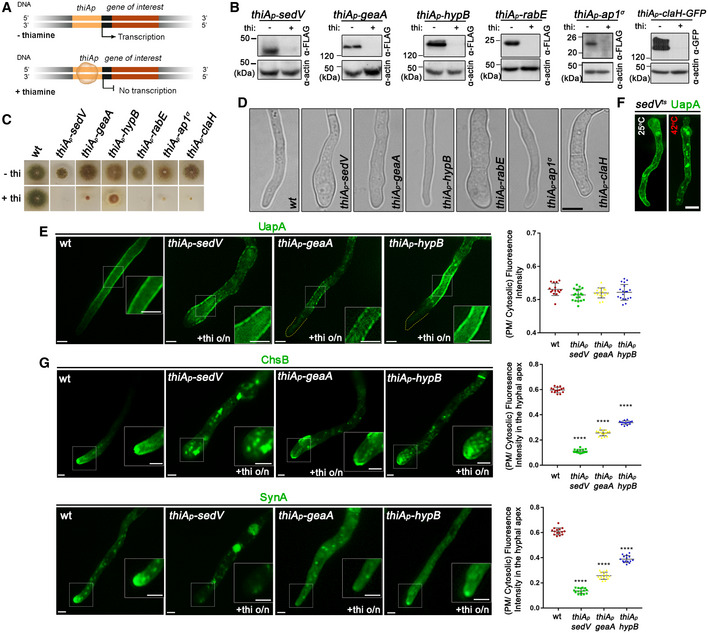
Figure 3. Localization of neosynthesized UapA in the PM when conventional secretion is blocked.

-
ASchema depicting the strategy for blocking conventional secretion.
-
BKey endogenous genes controlling Golgi (sedV, geaA, hypB) or post‐Golgi trafficking (rabE, ap1 σ , claH) were genetically replaced by versions transcribed under the highly repressible thiA p promoter via targeted homologous recombination. In the absence of thiamine from the growth medium (derepressed conditions), the relative proteins are expressed, while upon addition of thiamine at the onset of conidiospore germination (ab initio repression), the expression of these proteins is tightly repressed. Proteins are detected by a standard Western blot analysis using either anti‐FLAG or anti‐GFP antibodies for Golgi and Post‐Golgi proteins. Equal loading and protein steady‐state levels are normalized against the amount of actin, detected with a specific antibody.
-
CIn the absence of thiamine from the growth medium (derepressed conditions), the corresponding strains grow nearly as an isogenic wild‐type control, although a delay in growth is observed for thiA p ‐sedV and less so for thiAp‐ap1 σ (upper row). In the presence of thiamine to the growth medium, most cells do not form colonies, except for thiA p ‐hypB which forms a compact slow‐growing colony (lower row).
-
DMicroscopic examination of the corresponding strains under thiamine (repressing conditions) shows that, in most cases, the apical region of germlings is enlarged and growth is arrested. This morphological phenotype, taken as a strong indication of blocked secretion, is more evident in thiA p ‐sedV and thiA p ‐rabE but concerns all strains, except for thiAp‐hypB. Scale bar: 5 μm.
-
ESubcellular localization of UapA, after 6–8 h of initiation of transcription, via its native uapA promoter, while conventional sedV, geaA or hypB transcription is repressed by thiamine ab initio. Scale bars: 2 μm. Notice that UapA‐GFP translocates in the PM of germlings in all cases. Results shown are confirmed by quantification (right panel) of UapA‐GFP PM/cytosolic intensity ratios for the four strains (for details, see Materials and Methods). Mean PM/cytosolic intensity ratios for wild‐type, thiA p ‐sedV, thiA p ‐geaA and thiA p ‐hypB are 0.53 ± 0.02, 0.52 ± 0.02, 0.52 ± 0.02 and 0.52 ± 0.02, respectively. For the statistical analysis, Tukey's multiple comparison test was performed (one‐way ANOVA). No statistical significance was found between the wild type and each of the mutant strains. Biological/technical replicates: 3/15 for wild type, 3/18 for thiA p ‐sedV, 3/15 for thiA p ‐geaA and 3/18 for thiA p ‐hypB.
-
FalcA p‐UapA‐GFP, under derepressing conditions, translocates to the PM of a strain carrying a thermosensitive mutation in SedVts both at the permissive (25°C) and restrictive temperature (42°C). A degree of increased degradation of UapA, caused by exposure to high temperature (42°C), is apparent as cytosolic puncta, which correspond to membrane aggregates and sorting to vacuoles. Scale bar: 5 μm.
-
GUnlike UapA, de novo made apical markers, such as ChsB or SynA, lose their polar localization, when the expression of sedV, geaA or hypB is repressed. Scale bars: 2 μm. Quantification: GFP‐ChsB PM/cytosolic and alcA p ‐GFP‐SynA PM/cytosolic intensity ratios are plotted to the right upper and lower panel, respectively. For GFP‐ChsB, mean PM/cytosolic intensity ratios are 0.60 ± 0.02 (wild type), 0.11 ± 0.01 (thiA p ‐sedV), 0.26 ± 0.02 (thiA p ‐geaA) and 0.34 ± 0.01 (thiA p ‐hypB). For alcA p ‐GFP‐SynA, mean PM/cytosolic intensity ratios for wild type, thiA p ‐sedV, thiA p ‐geaA and thiA p ‐hypB are 0.61 ± 0.03, 0.14 ± 0.02, 0.26 ± 0.03 and 0.39 ± 0.03, respectively. The statistical analysis was performed as in (E). A significant difference (****P < 0.0001) of GFP‐ChsB fluorescence in the apical PM membrane was found between the wild‐type and the three strains lacking the key‐Golgi proteins. This is also the case for SynA, as seen in the scatter plot on the lower right panel, where the fluorescence intensity of SynA is diminished (****P < 0.0001) when sedV, geaA and hypB are repressed. Biological/technical replicates: 3/15 for each strain.
Source data are available online for this figure.
