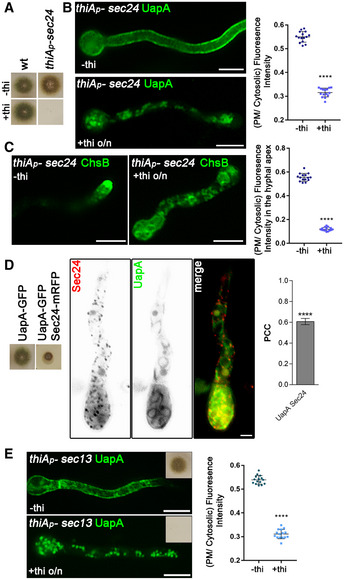
Figure 4. COPII vesicle formation is required for ER‐exit and PM localization of UapA.

-
AGrowth test showing that Sec24 expression is essential for growth as its transcriptional repression by thiamine (+thi) leads to the absence of colony formation, despite initial germination (images at panels B and C). The strains shown are isogenic except for the sec24 locus. thiA p ‐sec24 signifies the strain where the endogenous sec24 promoter was replaced by the thiA p promoter.
-
BEpifluorescence microscopy analysis of the subcellular localization of UapA‐GFP under conditions where sec24 transcription is ab initio derepressed (upper panel) or repressed by thiamine (lower panel). o/n (overnight) means addition of thiamine from the onset of germination. Germination of conidiospores takes place until full repression of Sec24 is achieved (10‐12 h). Notice the total lack of PM‐associated signal of UapA under conditions of Sec24 repression. Scale bar: 5 μm. Quantification: In the scatter plot on the right, UapA‐GFP PM/cytosolic intensity ratios are quantified when sec24 is derepressed (−thi) or repressed (+thi). Mean PM/cytosolic intensity ratios are 0.55 ± 0.02 and 0.32 ± 0.02, respectively. To test the significance of differences, an unpaired t‐test was performed, which verified the significant difference (****P < 0.0001) in the presence of thiamine. Biological/technical replicates: 2/15 for each condition.
-
CEpifluorescence microscopy analysis of the subcellular localization of the apical marker chitin synthase (GFP‐ChsB) under sec24 derepressed or repressed conditions. Notice the loss of apical depositioning and the concurrent labelling of cytoplasmic foci and membranous structures under repression conditions. Scale bar: 5 μm. Quantification: GFP‐ChsB PM/cytosolic intensity ratios are plotted in cases where sec24 is derepressed (‐thi) or repressed (+thi). Mean values are 0.56 ± 0.03 and 0.12 ± 0.02, respectively. The fluorescence intensity of GFP‐ChsB is statistically lower (****P < 0.0001) when the expression of sec24 is repressed (statistical analysis as in B). Biological/technical replicates: 2/15 for each condition.
-
DCo‐localization analysis by epifluorescence microscopy of Sec24‐mRFP and de novo made UapA‐GFP (8 h derepressed transcription). Quantification of co‐localization was made by calculating Pearson's correlation coefficient. For the statistical analysis, one sample t‐test was used. Notice the significant co‐localization (PCC = 0.61 ± 0.07, ****P < 0.0001). Due to the partially functional mRFP‐tagged version of Sec24 (evident in the growth test shown on the left panel), UapA trafficking is significantly delayed, reflected in the appearance of prominent labelling of uniform perinuclear ER. Scale bar: 5 μm. Biological/technical replicates: 3/5.
-
EEpifluorescence microscopy analysis of the subcellular localization of UapA‐GFP under conditions where sec13 transcription is ab initio derepressed (left panel) or repressed by thiamine (right panel). The inserts in the upper right corner in both panels reflect growth tests showing that Sec13 repression leads to arrest in growth and absence of colony formation. Scale bars: 5 μm. All images reflect practically identical results obtained in several experiments. Quantification: UapA‐GFP PM/cytosolic intensity ratios are quantified when sec13 is derepressed (‐thi) or repressed (+thi), with mean values being 0.54 ± 0.02 and 0.31 ± 0.02, respectively. There is a significant difference on UapA PM fluorescence intensity (****P < 0.0001) in the absence of the COPII outer coat protein (statistical analysis as in B). Biological/technical replicates: 2/15 for each condition.
Source data are available online for this figure.
