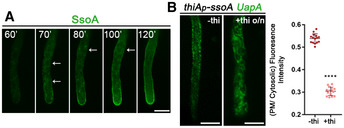
Figure 7. The t‐SNARE SsoA is essential for UapA translocation to the PM.

-
ASubcellular localization of de novo made alcA p ‐GFP‐SsoA in the PM in a single hypha. Notice the ER‐like membranous network (white arrows) and several cytosolic puncta labelled before SsoA reaches eventually the PM. Scale bar: 5 μm.
-
BSubcellular localization of neosynthesized UapA‐GFP (8 h after transcriptional depression) while ssoA transcription is ab initio repressed. Notice the localization of UapA in the ER‐membranous network, often at very close proximity with the PM. Scale bar: 5 μm. In the scatter plot on the right, UapA‐GFP PM/cytosolic intensity ratios are quantified when ssoA is derepressed (−thi) or repressed (+thi), with mean values being 0.54 ± 0.02 and 0.30 ± 0.02, respectively. There is statistically lower fluorescence intensity to the PM (****P < 0.0001) when SsoA is absent from the cell, as confirmed by an unpaired t‐test. Biological/technical replicates: 2/15 for each condition.
Source data are available online for this figure.
