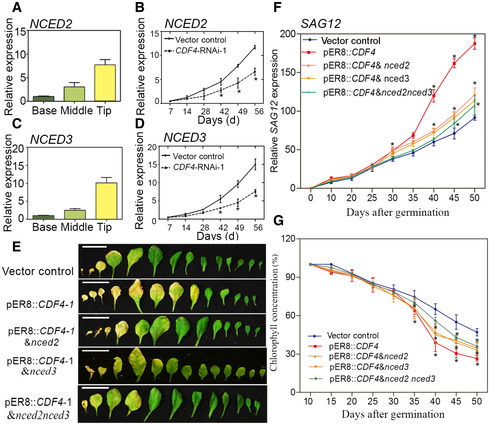
Figure 4. Involvement of NCED2 and NCED3 in the progression of leaf senescence in the vector control, pER8::CDF4, pER8::CDF4 & nced2, pER8::CDF4 & nced3, and pER8::CDF4 & nced2nced3 plants.

-
A–DTranscript levels were determined by qPCR and normalized to AtACT2. (A, C) Localized NCED2 and NCED3 expression in the wild‐type senescing leaf. Half‐senesced leaves were split into three parts, as shown in Fig 1A and C. (B, D) NCED2 and NCED3 expression during leaf senescence in the vector control and CDF4‐RNAi‐1 plants. Transgenic plant leaves were analyzed from 7 to 56 d (d, days after planting). Four independent experiments were conducted. Values are given as mean ± SD, n = 4. *P < 0.05 by Student's t‐test.
-
EObservation of rosette leaf longevity from the 26‐day‐old vector control, pER8::CDF4, pER8::CDF4 & nced2, pER8::CDF4 & nced3, and pER8::CDF4 & nced2nced3 transgenic plants after 20 μM estradiol induction for 2 weeks. Phenotype of detached rosette leaves arranged from oldest to youngest. Scale bars indicate 1.5 cm.
-
F, G(F) SAG12 expression level and (G) chlorophyll concentration in rosette leaves in (E) at various development stages. Three independent experiments were conducted. Values are given as mean ± SD, n = 4. *P < 0.05 by Student's t‐test.
Source data are available online for this figure.
