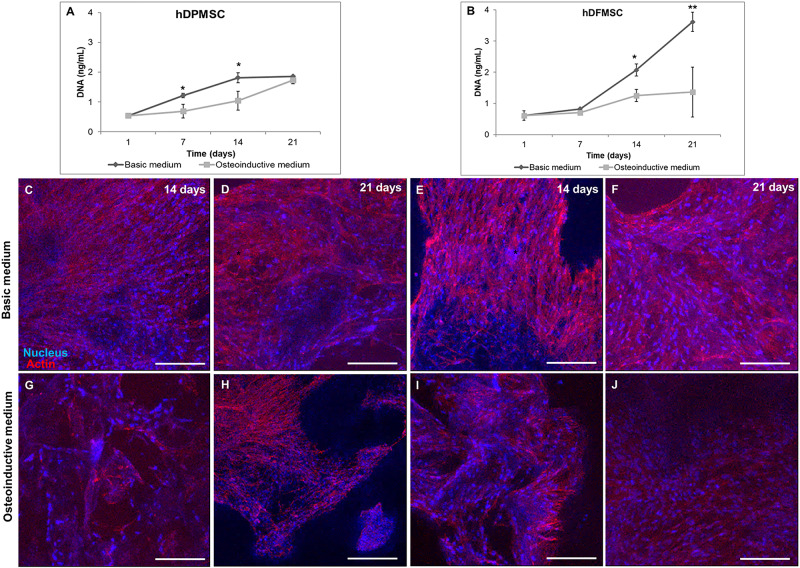
FIGURE 1.
DNA concentration of hDPMSC (A) and hDFMSC (B) cultured within Coll-nanoHA/OPS for 7, 14 and 21 days in the basic vs. osteoinductive medium. Statistical analysis *p < 0.05 and **p < 0.01. CLSM maximum Z projection images (200 μm depth) of hDPMSC (C,D,G,H) and hDFMSC (E,F,I,J) cultured for 14 and 21 days within collagen-nanoHA/OPS biocomposite scaffolds in the basic or in the osteoinductive medium osteoinductive medium. Scale: 200 μm.

