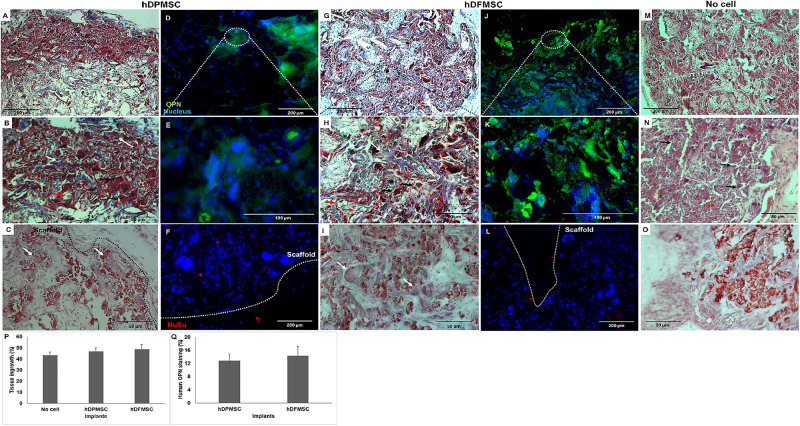
FIGURE 8.
Optical microscopy images of dental MSCs (hDPMSC – A,B,C and hDFMSC – G,H,I) within Collagen-nanoHA/OPS scaffolds implanted for 8 weeks. Slides were stained by Masson Trichrome (A,B,G,H) and Alizarin red (C,I). (M,N) Implants of scaffolds without cells after 8 weeks. (O) Implants without cells were stained with Alizarin red. Black dashed line - scaffold surface, white arrows – bone-like tissue, red arrows - new blood vessels and black arrows - giant cells. Scale: (A,G,M) 200 μm and (B,C,H,I,N,O) 50 μm. Fluorescence microscopy images of dental MSCs (hDPMSC – D,E,F,hDFMSC – J,K,L) within collagen-nanoHA/OPS scaffolds and implanted for 8 weeks. Blue – Nucleus (DAPI), Green – Human Osteopontin, Red – human nucleus (HuNu), White dashed line – scaffold surface. Scale: (A,F,J,L) 200 μm and (E,F) 100 μm. (P) 3D Coll/nanoHA scaffolds with and without human dental MSCs (percentage of the total section area). (Q) Human OPN presence within the scaffolds with hDPMSC or hDFMSC.

